Fig. 2.

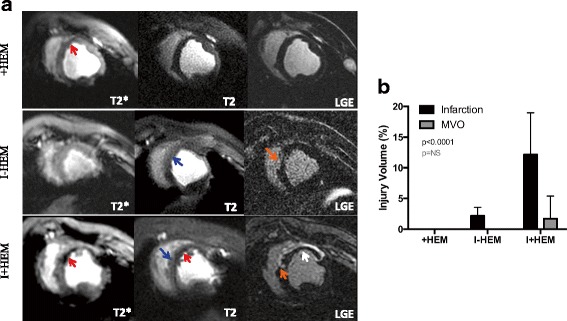
Myocardial Injury and Microvascular Obstruction. a Representative T2*-weighted (TE = 16 ms), T2-weighted (TE = 88 ms) and LGE images from a representative animal in each of the three groups, demonstrating the tissue response at 24 h. The arrows are indicative of the following pathophysiological features: Red – Hemorrhage; Blue – Edema; Orange – Infarction; and White – MVO. Only +HEM and I+HEM groups demonstrated hemorrhage as indicated by low signal intensities on T2* images. The I-HEM group was non-hemorrhagic with a small infarction. High signal intensity on T2 images suggested the presence of edema in the LAD territory in all three groups. No infarction was detected in the hemorrhage only (+HEM) group, but when coupled with an ischemic insult (I+HEM group), it resulted in a large infarction with MVO. b Plot compares the cumulative infarct and MVO volumes across the three groups
