Fig. 4.

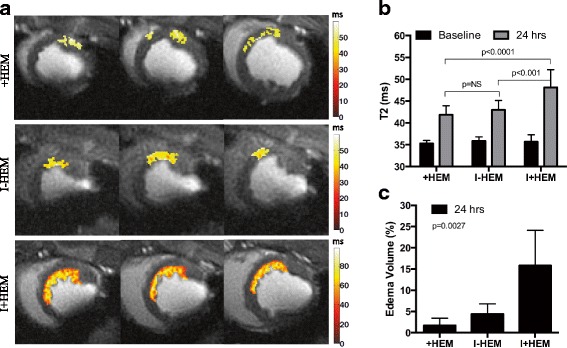
Edema (T2). a Representative T2-weighted (TE = 88 ms) images showing a color overlay of edema extent, from animals in the three groups. Edematous tissue was segmented using the two standard deviation above remote T2 threshold criteria. Each row shows multiple slices from the same animal. Note that edema in the +HEM group was discontiguous (unlike an infarct) potentially due the non-uniform distribution of hemorrhage. b Plot shows that T2 values were significantly elevated (from baseline) in the affected LAD territory in all three groups, thus quantifying edematous development. c Plot demonstrates that edema volume was the greatest when hemorrhage and ischemia were coupled together in the I+HEM group
