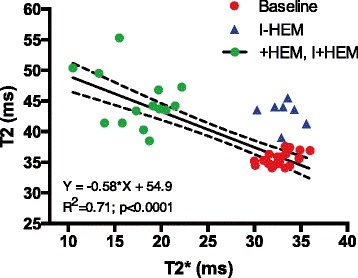
Fig. 5.

Hemorrhage and Edema. Plot demonstrates that the inflammatory response (edema), represented by higher T2 values, was highly correlated with the presence of hemorrhage, represented by lower T2* values. The correlation was tested in animals presenting with myocardial hemorrhage (+HEM, I+HEM groups); non-hemorrhagic animals (I-HEM group) are shown in the plot but were excluded in the analysis
