Fig. 2.

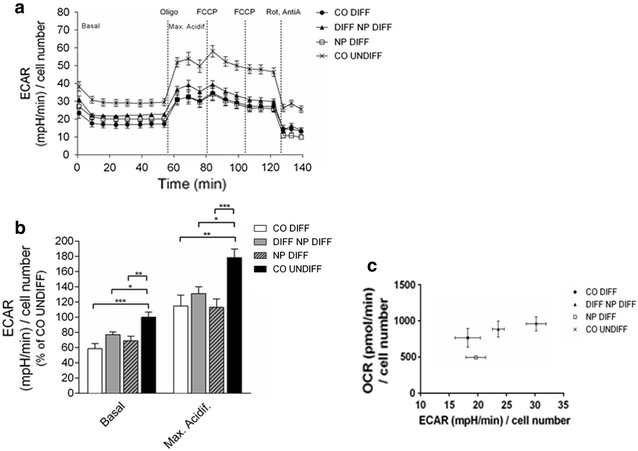
The extracellular acidification rate (ECAR) was measured using a Seahorse Biosciences XF24 Analyser. The bioenergetic activity was analyzed in SH-SY5Y neuroblastoma cells exposed to PCL-NPs for 24 h before differentiation (NP DIFF) or during differentiation (DIFF NP DIFF) on day in vitro (DIV) 1 and DIV4, respectively. Untreated SH-SY5Y cells, either non-differentiated (CO UNDIFF) or differentiated for 6 days (CO DIFF), were analyzed in parallel (a, b). SH-SY5Y cells were exposed sequentially to each mitochondrial modulator of mitochondrial activity (oligomycin, FCCP and rotenone/actinomycin A). The mean ± SEM of the mitochondrial stress test on ECAR are depicted over time (a). A quantitative analysis of the data is depicted in (b). Values represent the mean + SEM; n = 5 replicates of five independent experiments. *p ≤ 0.05; **p ≤ 0.01; ***p ≤ 0.001; ****p ≤ 0.0001. The energy phenotype is depicted by ECAR on the x axis and the mitochondrial respiration is represented by the oxygen consumption rate (OCR) on the y axis. Bioenergetic profiling of SH-SY5Y cells (OCR versus ECAR) revealed decreased metabolic activity after exposure to PCL-NPs. Values represent the raw mean ± SEM of each group (mean of the ECAR in abscissa/mean of the OCR in ordinate) (c)
