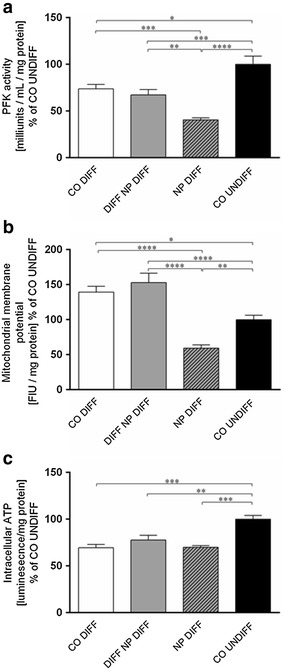
Fig. 4.

Phosphofructokinase (PFK) activity (a), mitochondrial membrane potential (ΔΨm) (b) and ATP production (c) were assessed in SH-SY5Y cells undifferentiated controls (CO UNDIFF), differentiated controls (CO DIFF) and exposed to PCL-NPs before (NP DIFF) or during (DIFF NP DIFF) differentiation. The histograms represent values calculated as percent of undifferentiated controls. Values are expressed as milliunits/ml/mg protein for PKF activity (a), fluorescence intensity unit (FIU)/mg protein for ΔΨm (b), as luminescence/mg protein for ATP production (c). Error bars represent the mean + SEM. Significant differences to undifferentiated and differentiated controls are labeled with asterisks (*p ≤ 0.05; **p ≤ 0.01; ***p ≤ 0.001; ***p ≤ 0.0001)
