Fig. 6.

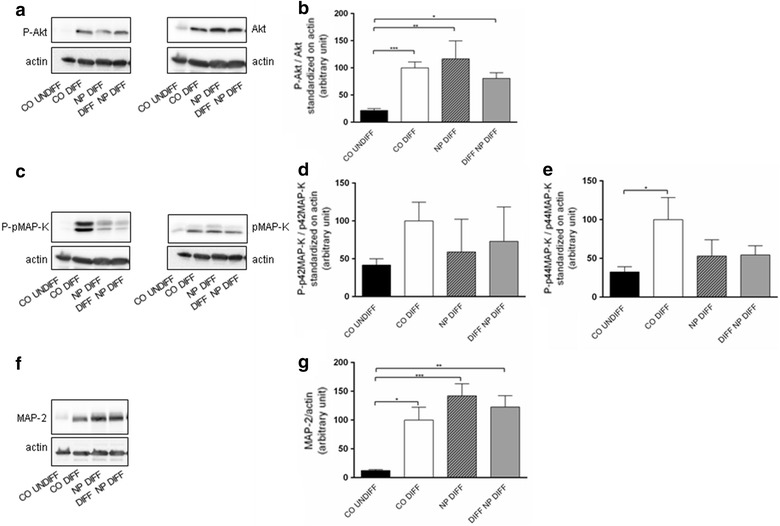
Markers of the PI3 kinase pathways (PI3-K/Akt), MAP kinase (MAP-K/ERK), and of mature neurons (MAP-2) were used to evaluate neuronal differentiation in SH-SY5Y cells exposed to PCL-NPs ([2.6 × 10¹⁰] PCL-NPs/ml) for 24 h before (DIV1, NP DIFF) or during (DIV4, DIFF NP DIFF) differentiation with retinoic acid added until DIV7. Untreated controls, undifferentiated SH-SY5Y cells (CO UNDIFF) and differentiated SH-SY5Y cells (CO DIFF) were performed in parallel. Representative Western blots are shown in (a, c, f). The histograms represent the ratio of phosphorylated Akt (P-Akt) (b) and phosphorylated p42/44-MAP-K (P-p42/44-MAP-K) (d, e) to Akt and p42/44-MAP-K. A histogram of the ratio MAP-2/actin is shown in (g). The actin signal was used as loading control. Respective protein levels were assessed using digital quantification of immunoblots, and they are presented as relative intensity compared to total protein. The analysis was done using ImageJ. Values are expressed with arbitrary units. Error bars represent the mean + SEM. Significant differences to undifferentiated and differentiated controls are labeled with asterisks (*p ≤ 0.05; **p ≤ 0.01; ***p ≤ 0.001)
