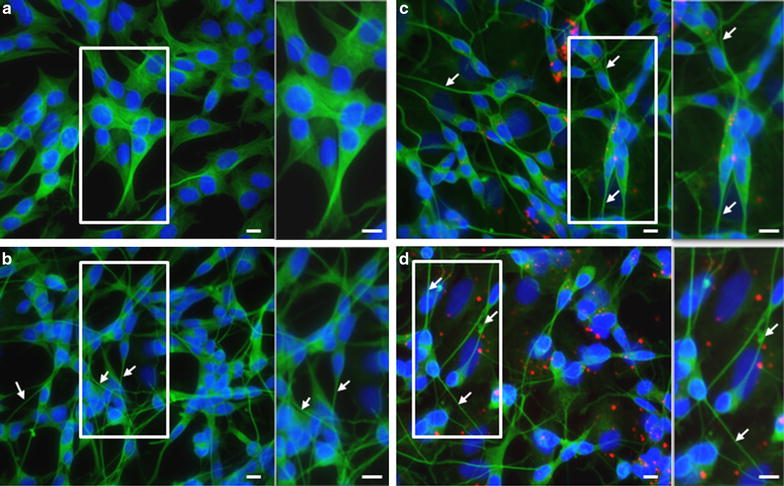
Fig. 7.

Representative microscopic images showing morphological features of SH-SY5Y cells, undifferentiated controls (a), differentiated controls (b) and exposed to NPs before (c) or during differentiation (d). At the end of the differentiation (DIV8), cells were stained with the neuronal marker β-3-tubulin (green), NPs appear in red (RITC labeling) and cell nuclei were counterstained with Hoechst (blue). The arrows depict neurites from differentiated neurons. Magnification 400×. Inserts demonstrate higher magnification of the square in the picture. Scale bars 10 μm
