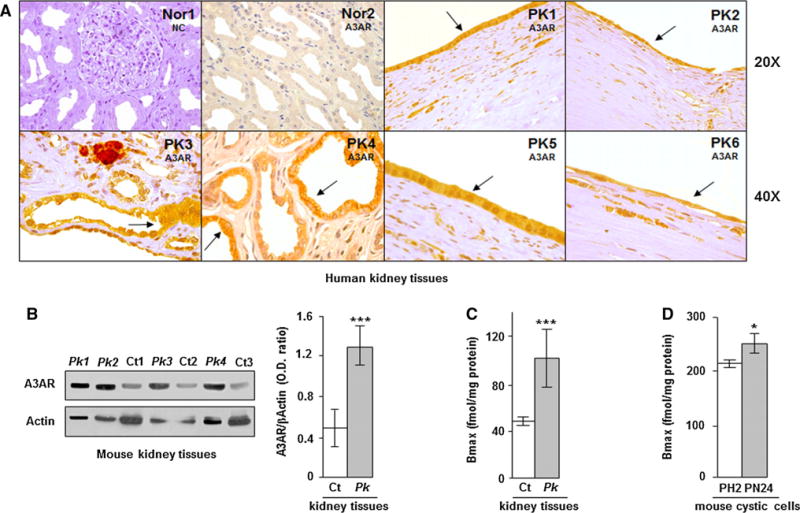
Fig. 1.

Analysis of A3AR by immunohistochemistry, western blotting, and saturation binding shows an increased expression of these receptors in renal cystic cells and tissues. a A3AR positivity detected by immunohistochemistry in human normal (Nor) and polycystic (PK) kidney tissues is mainly confined to flat cells of kidney cysts (see arrows); nc is the negative control (without primary antibody). b Western blot analysis shows increased levels of A3AR in kidney tissues of Pkd1flox/−:Ksp-Cre polycystic mice (Pk) compared with Pkd1flox/+:Ksp-Cre control mice (Ct). A3AR protein content was calculated as band intensity ratio between A3AR and β-Actin (Pk vs Ct: ***p < 0.001). Adenosine A3 receptors were also measured by saturation binding in cystic (Pk) and control (Ct) mouse kidney tissues (c) as well as in PN24 and PH2 mouse kidney cystic cells (d). A3 receptor density is higher in Pk tissue and PN24 cells than in Ct and PH2 (Pk vs Ct: ***p < 0.001 and PN24 vs PH2: *p < 0.05). Data are expressed as mean ± SD of at least three independent experiments
