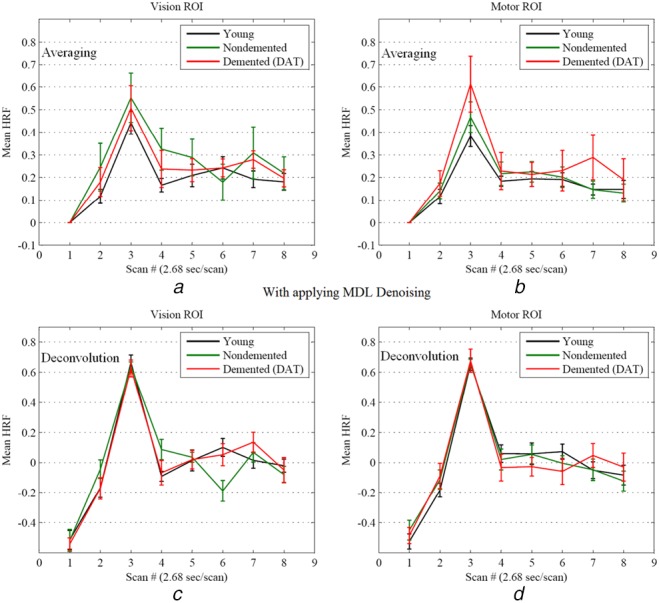
Fig. 2.

Mean HRF for vision and motor regions extracted from fMRI data with applying MDL denoising
a Mean HRF due to averaging in vision region (with applying MDL denoising)
b Mean HRF due to averaging in motor region (with applying MDL denoising)
c Mean HRF obtained from deconvolution in vision region (with applying MDL denoising)
d Mean HRF obtained from deconvolution in motor region (with applying MDL denoising). Error bars represent ±1 SEM. The black, green and red solid lines are associated with the mean HRF for the young, non-demented and demented elderly adults, respectively
