
Figure 3.
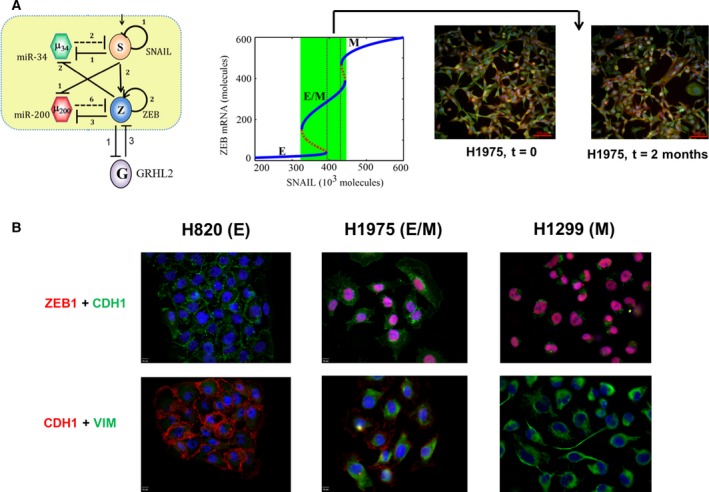
Characterizing a hybrid E/M phenotype. (A) (left) EMT circuit as shown earlier, with GRHL2 being incorporated based on literature about its interactions with ZEB. (middle) Bifurcation diagram depicting change in the levels of ZEB mRNA as a function of varying SNAIL levels, corresponding to the circuit diagram shown in left. It illustrates a monostable {E/M} region highlighted by dotted rectangle. (right) Immunofluorescence images for E‐cadherin (red) and VIM (green) in H1975 cells over multiple passages consistently show single‐cell co‐expression for both markers. (B) Immunofluorescence images for E‐cadherin, ZEB1, and VIM in H820, H1299, and H1975 cells.