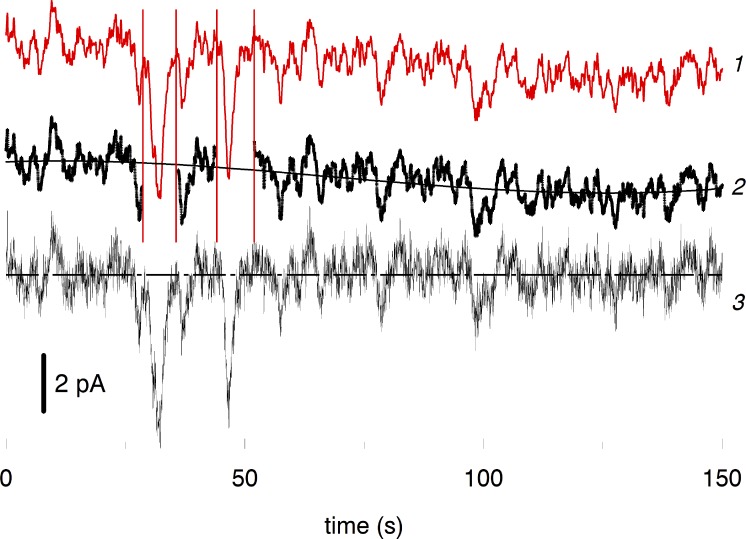
Figure 10.
Correction of the recordings for slow irregularities of the base line. Curve 1 is a stretch of an original recording low-pass filtered at 3 Hz to more clearly show discrete dark events. Curve 2, two discrete dark events marked with vertical lines are cut-off from the curve 1 leaving continuous noise. The smooth line through 2 is the best-fitting third-order polynomial representing the baseline drift. Curve 3 shows the original record filtered at 10 Hz and corrected for base line irregularity. The curves are separated vertically to facilitate comparison.

