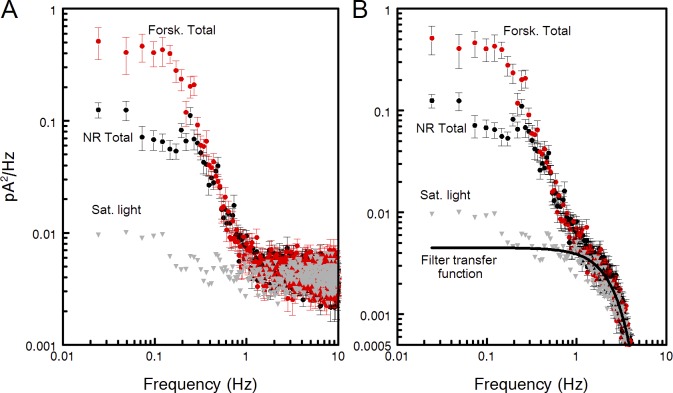
Figure 2.
Sample power spectra of total (continuous and discrete) dark noise in normal Ringer (NR) and forskolin perfusion (Forsk). Recordings were digitized at 2 ms and analogue-filtered at 20 Hz. During processing, the spectra were outputted at 10-ms digitization, and each spectrum computed as the mean of 30 epochs of 40.96-s duration. Error bars show SEMs. Dark current was 23 pA. (A) Raw spectra of the recordings without extra digital filtration. Gray triangles show the spectrum of the noise recorded in saturating light when all cGMP-gated channels are closed. This spectrum was further used as characterizing instrumental noise. (B) Spectra of A digitally filtered by ksmooth function in MathCad using 165-ms window that is a good approximation of 8-pole Bessel 3-Hz filtration. The power gain transfer function of the filter is shown by the heavy black line. The curve is downscaled for best match to the mean of all three experimental spectra between 1 and 10 Hz.

