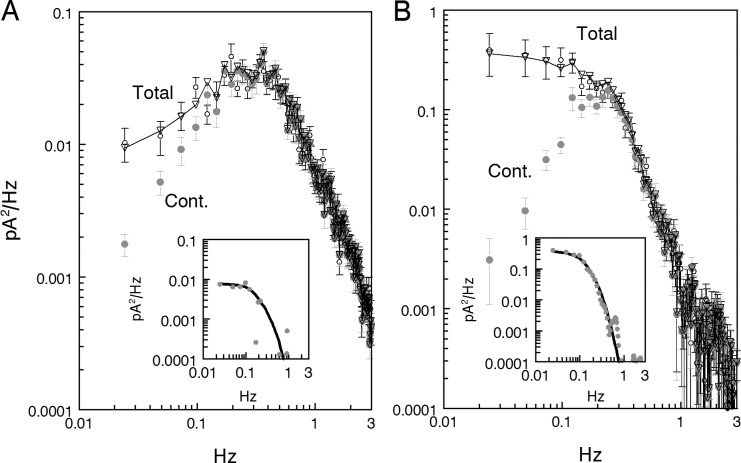
Figure 3.
Separation of discrete and continuous noise. (A) Normal Ringer. (B) Forskolin-containing perfusion. Same spectra as in Fig. 2 B, but corrected by subtracting instrumental noise. Graphs labeled Total refer to original recordings containing both continuous and discrete noise. Graphs labeled Continuous were calculated from recordings with manually removed discrete dark events as described in the Appendix. 13 discrete events were counted in A and 19 events in B, yielding a mean interval between events of 92 and 63 s, respectively. Insets show difference spectra between Total and Continuous curves smoothed with 3-point running mean (gray circles). Smooth black lines in the insets show power spectra of model fits to averaged SPRs, one event per 92 s in A and one event per 53 s in B. If the SPR spectra are summed with the corresponding continuous spectra, the result fits total noise quite well (downward triangles in main panels). The frequency of discrete events derived from spectral fit in normal Ringer coincides with that obtained by direct count. In forskolin (B), however, the events rate derived from spectral fit was substantially higher than follows from direct count. A possible reason for discrepancy is given in the Discussion.

