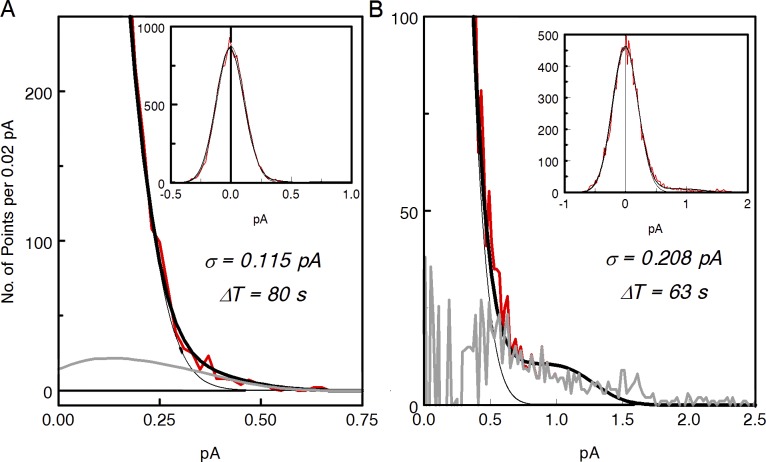
Figure 4.
Determining the rate of discrete dark events by histogram fit. (A and B) Noisy black lines in insets show histograms of the noise current values in normal Ringer (A) and in Ringer + 2 mM forskolin (B). Histogram bin 0.01 pA. Heavy black lines in main panes are best approximations of the experimental histograms with the Eq. 1. As r(t) in Eq. 1, SPRs determined from few-photon statistics were taken. Parameters of the fits are given in each panel. Thin black lines show the Gaussians component of the continuous noise from Eq. 1. Difference in the mean rate of the spontaneous events between A and B is apparently the result of statistical fluctuations. The full set of data from the cell shows no statistically significant effect of forskolin on discrete events rate (Table 2). The noisy gray line in B shows the difference between the experimental histogram and Gaussian of the continuous noise. It represents the contribution of discrete events to histogram. The smooth gray line in A is the difference between total fitted histogram and the Gaussian of continuous noise. It is supposed to be an analogue of the gray curve in B that cannot be reasonably computed in A because of poor SNR.

