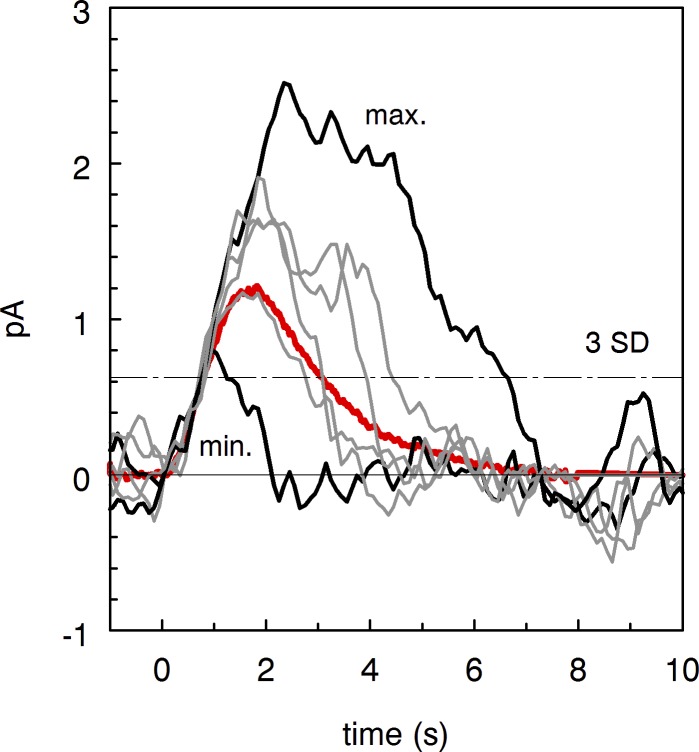
Figure 6.
Comparison of individual discrete events in forskolin-containing perfusion. Discrete events were identified as peaks crossing three SDs of the continuous noise and excised from the recording shown in Fig. 1 B. Then individual waves were shifted along the time axis for the least squares match between their initial rising phases. Mean of 15 excised dark events is similar to mean SPR taken from Fig. 1 A (heavy red line). The dot-dashed horizontal line shows the criterion level to select discrete events.

