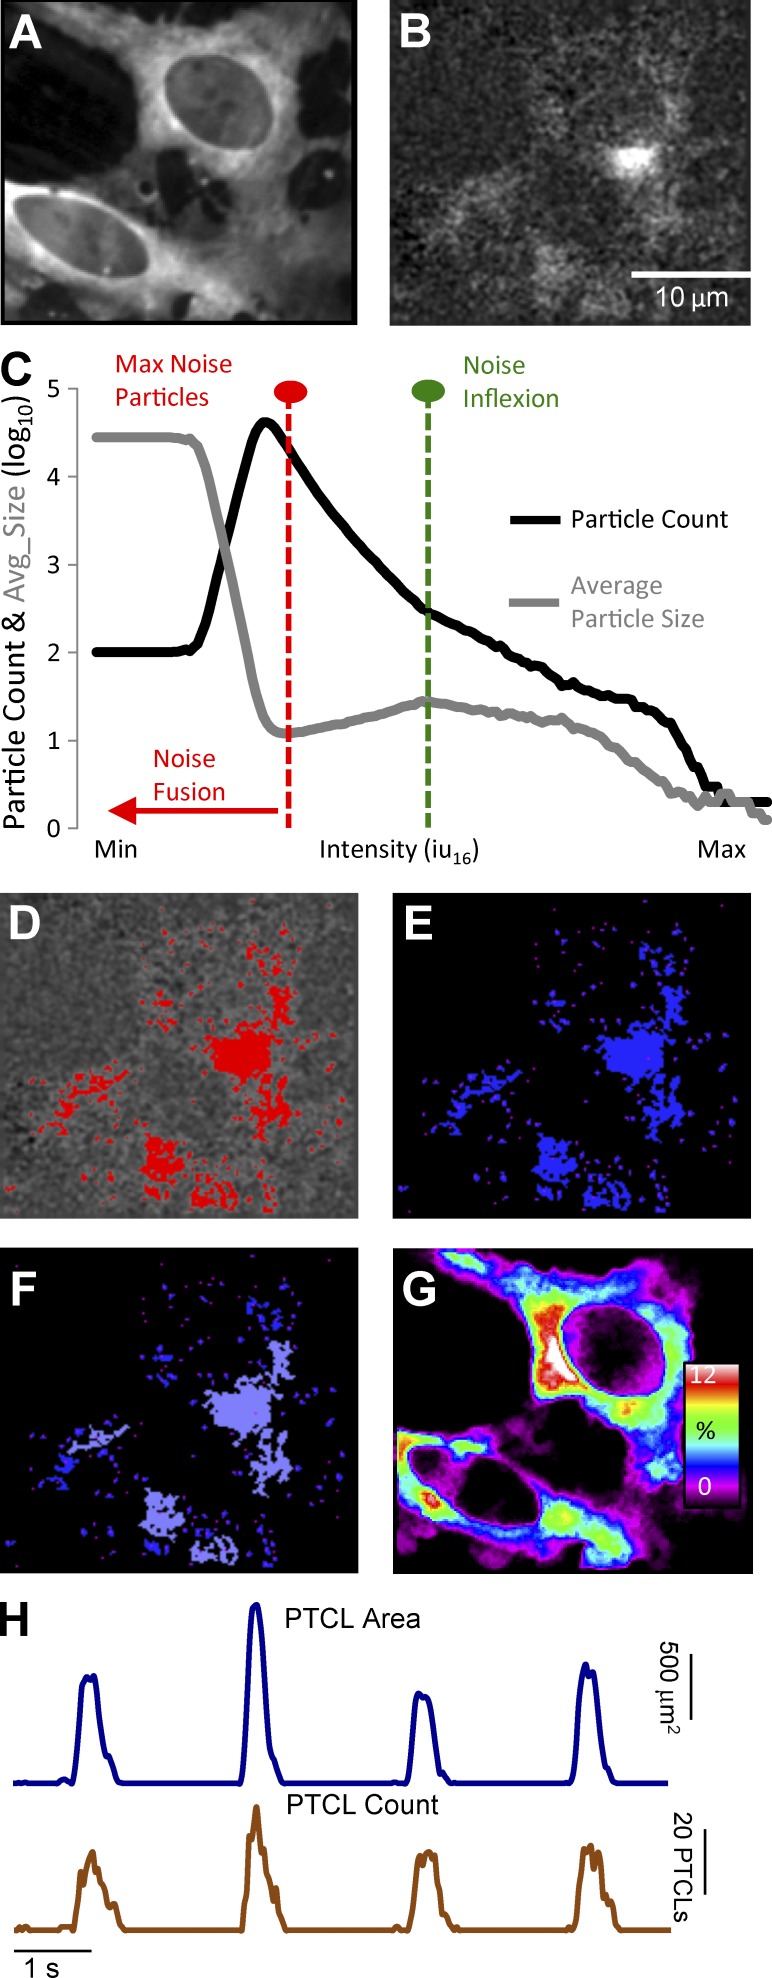
Figure 1.
Analysis of Ca2+ transients in ICC-MY. (A) Representative image of an ICC-MY network from the small intestine of a Kit-Cre-GCaMP3 mouse imaged at 60× magnification. (B) Image taken from the video shown in A after a differential of Δt = ±66–70 ms and a Gaussian filter of 1.5 × 1.5 µm, StdDev 1.0 was applied. Scale bar in B applies to A, B, and D–G. (C) Traces of particle count and mean particle size in a thresholding protocol to eliminate noise in the video shown in A (see Materials and methods section Calcium transient analysis for detailed protocol). (D) Image taken from the video in B after thresholding was completed with particles above threshold (thresholding protocol shown in C) shown in red. (E) Representative image from the coordinate-based Ca2+ particle file created from the thresholded video in D. (F) Representative image taken from the particle file of E after a criteria of >6 µm2 (diameter ∼2 µm or smaller) was applied; particles above this limit are flagged as purple particles and considered valid PTCLs. (G) Heat map showing the total PTCLs for an entire recording summated with colors representing percentage of occurrence throughout the video (warm colors indicate increased occurrence at that location). (H) Activity traces for PTCLs for the duration of recording from the entire FOV for the representative example shown in A–G. Traces are shown for PTCL area (dark blue) and PTCL count (brown).

