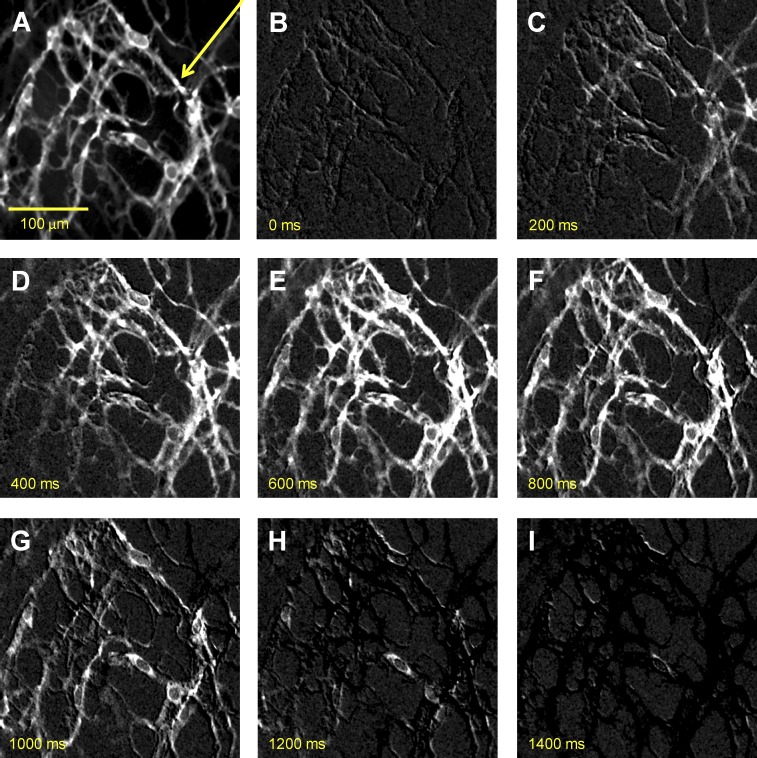
Figure 2.
Propagating Ca2+ waves in ICC-MY network. (A) An image of ICC-MY network from the small intestine of a Kit-Cre-GCaMP3 mouse visualized at 20× magnification. (B–I) Representative montage of the propagation of a Ca2+ wave throughout the ICC-MY network. All images in B–I were differentiated (Δt = ±66–70 ms; see Materials and methods) to minimize background noise. The scale bar in A pertains to all other panels. The yellow arrow in A indicates the direction of Ca2+ transient propagation.

