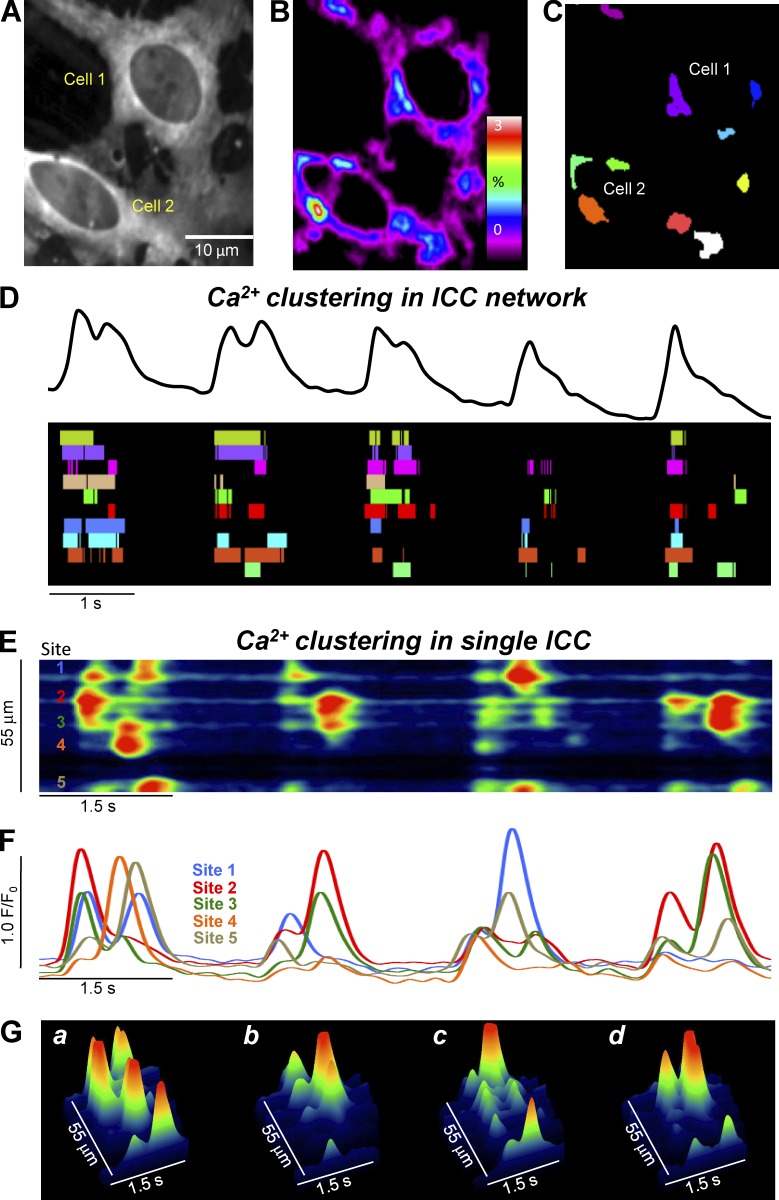
Figure 3.
Ca2+ transients in ICC-MY arise from multiple firing sites. (A) Representative image of an ICC-MY network from the small intestine of a Kit-Cre-GCaMP3 mouse imaged at 60× magnification. (B) Heat map of PTCLs generated from the video shown in A (see method section in Fig. 1). Particles were summated in the resulting heat map to indicate Ca2+ firing sites in ICC-MY. (C) Map showing the Ca2+ firing sites in the FOV identified in B individually color coded. (D) Ca2+ activity trace shown in black (total Ca2+ signal of the entire ICC-MY network in FOV) from the video in A over the course of five consecutive CTC cycles. An occurrence map of the activity of individual firing sites is shown below the trace. The temporal characteristics of each individually color coded firing site are displayed as a striped occurrence map, with each “lane” representing the occurrence of PTCLs within each single firing site. (E) ST map of CTCs from the soma of cell 1 (single ICC) from the video in A showing four consecutive CTC cycles. Ca2+ activity is color coded with warm areas (red, orange) representing bright areas of Ca2+ fluorescence and cold colors (blue, black) representing dim areas of Ca2+ fluorescence. Five distinct firing sites within CTCs are marked on the left of the ST map. (F) Traces of the CTCs at each of the five distinct Ca2+ firing sites shown on the ST map in E. (G) 3-D surface plots showing the Ca2+ activity at the five distinct Ca2+ firing sites shown on the ST map in E over four consecutive CTC cycles.

