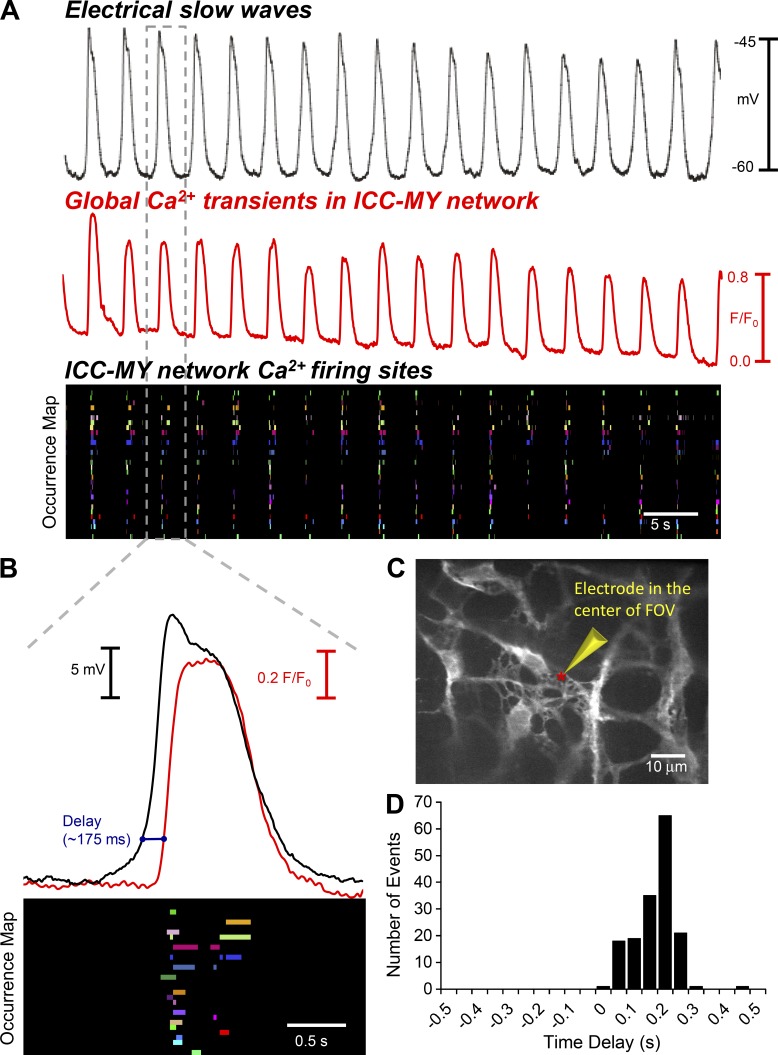
Figure 5.
Simultaneous recordings of Ca2+ firing in ICC-MY and electrical slow waves. (A) Representative recording of electrical slow waves (black trace) recorded from the circular smooth muscle layer of murine small intestine from a Kit-Cre-GCaMP3 mouse and simultaneously recorded Ca2+ transients (red trace) obtained from the total ICC-MY Ca2+ signal from the entire FOV of recording at 60× magnification. An occurrence map showing the pattern of firing of color coded individual Ca2+ firing sites from the ICC-MY network in the entire FOV is shown in the below trace. (B) Expanded example of a single electrical slow wave (black) and entire ICC-MY FOV Ca2+ transients (red) and Ca2+ firing site occurrence map (event 3 from A, as indicated by the projections of the doted gray box). Note the delay between electrical and Ca2+waves is ∼175 ms (blue line). (C) Representative image of ICC-MY network recorded during intracellular electrical recording; the red asterisks indicate the position of the recording electrode. (D) Frequency histogram of time delays between electrically recorded slow waves in the circular smooth muscle layer and subsequent Ca2+ responses of ICC-MY in the field of view (n = 8).

