Figure 9.
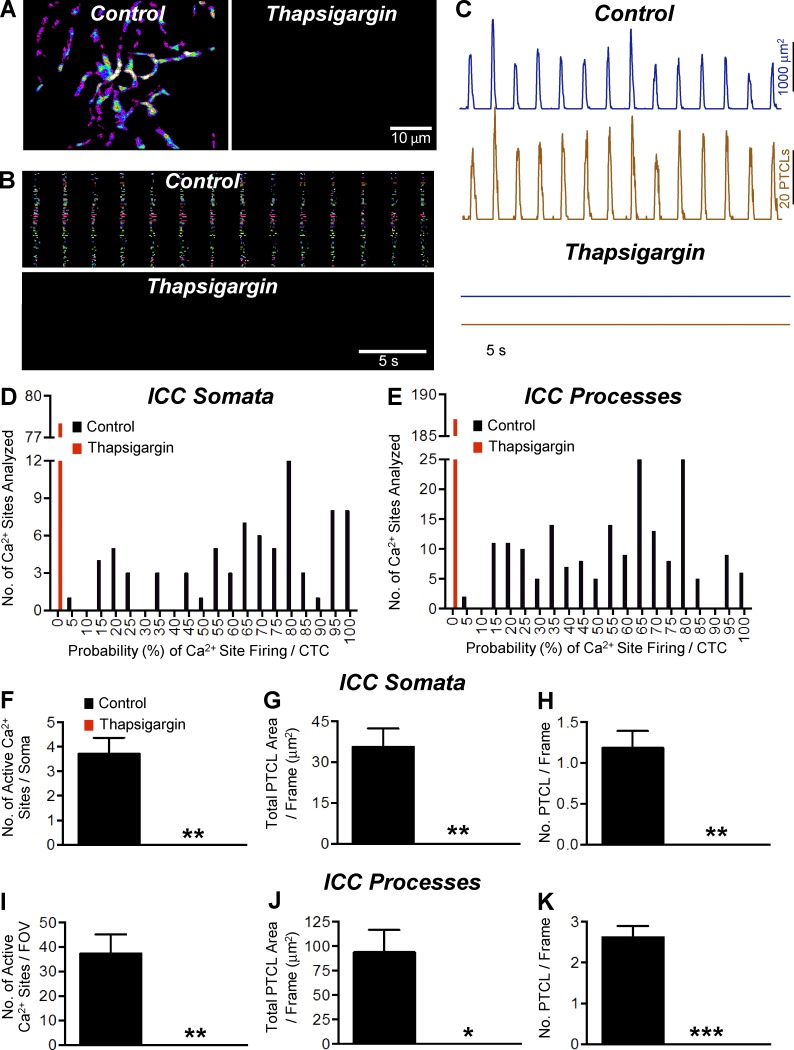
The effect of thapsigargin on Ca2+ transients in ICC-MY. (A) Representative heat map showing the summated PTCLs for an entire 60× magnification recording of ICC-MY in control and thapsigargin (10 µM). (B) Occurrence map of individually color-coded Ca2+ firing sites in the ICC-MY network in control and thapsigargin (10 µM) conditions. (C) Traces of PTCL activity over an entire recording of the ICC-MY network in control conditions and in the presence of thapsigargin (10 µM) showing PTCL area (dark blue) and PTCL count (brown). (D) Histogram showing the probability (%) that an individual Ca2+ firing site in the ICC-MY cell somata will fire during a CTC cycle in control conditions (black bars) and thapsigargin (10 µM; red bars; n = 5, FOV = 5). (E) Histogram showing the probability (%) that an individual Ca2+ firing site in the ICC-MY cell processes will fire during a CTC cycle in control conditions (black bars) and thapsigargin (10 µM; red bars; n = 5, FOV = 5). (F) Summary data showing the effect of thapsigargin (10 µM) on the number of active Ca2+ firing sites in the cell soma of ICC-MY (n = 5, FOV = 5). (G) Summary data showing the effect of thapsigargin (10 µM) on the total PTCL area per frame in the cell somata of ICC-MY (n = 5, FOV = 5). (H) Summary data showing the effect of thapsigargin (10 µM) on the total PTCL count per frame in the cell somata of ICC-MY (n = 5, FOV = 5). (I–K) Summary data showing the effect of thapsigargin (10 µM) on the number of active Ca2+ firing sites (I); total PTCL area per frame (J; n = 5, FOV = 5) and total PTCL count per frame (K) in the cell processes (n = 5, FOV = 5). *, P < 0.05; **, P < 0.01; ***, P < 0.001. Mean ± SE is shown.

