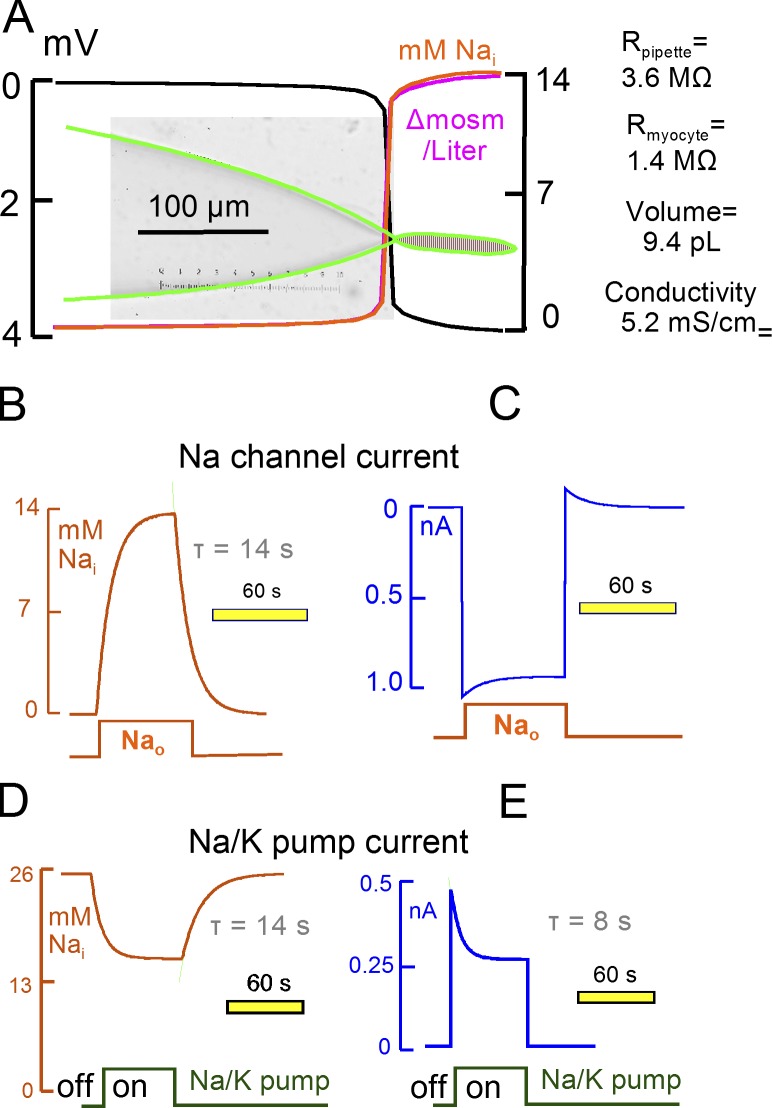
Figure 1.
Simulation of Na diffusion and turnover in a patch-clamped cardiac myocyte. The pipette resistance is 3.6 MΩ when using the standard low-conductance (5.2 mS/cm) NMDG-Asp–containing pipette solution. Myocyte volume is 9.4 pL, and the longitudinal myocyte resistance is 1.4 MΩ. (A) The micrograph of the pipette includes the microscope reticule (15 µm/large divisions). The pipette dimensions are accurately duplicated by a rectangular hyperbola (green lines). Diffusion of three ions was simulated as described in Materials and methods. The predicted electrical potential, Na concentration, and osmolarity gradients are shown during a 1 nA Na current at a 40-s time point. (B) Time dependence of Na concentration changes in the middle of the myocyte during activation of a 1 nM Na current for 60 s with 0 mM Na in the pipette. Here and in subsequent figures, we superimpose individual records with the best-fit exponential functions used to estimate time constants as faint lines, here in green. (C) Time dependence of membrane current during the responses in C. (D) Time dependence of cytoplasmic Na concentration changes with a 25 mM pipette Na concentration, during and after activation of enough Na/K pumps to generate a 0.5 nA pump current. Na/K pumps do not inactivate and the simulation includes no other conductance. (E) Time dependence of membrane current during the responses simulated in D.

