
Figure 9.
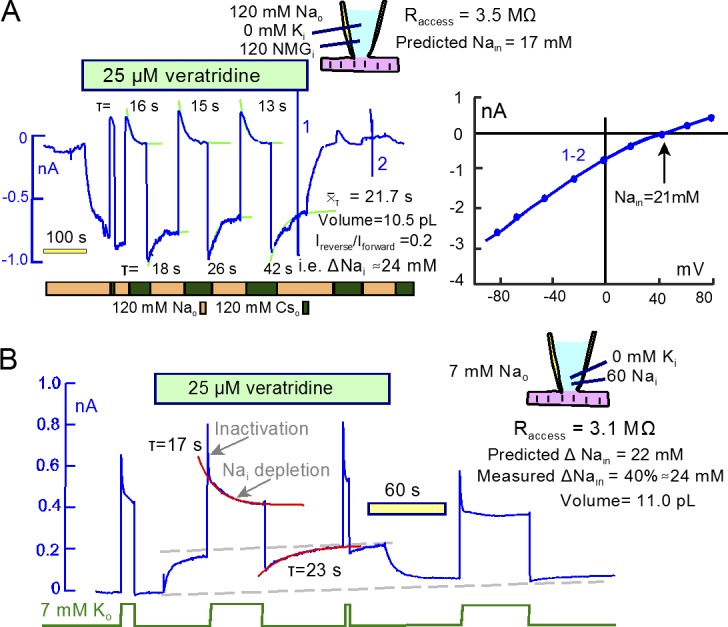
Large Na and Na/K pump currents cause cytoplasmic Na concentration changes with a τ of ∼20 s. (A) A high veratridine concentration (25 µM) activates continuous Na currents of ∼1 nA. The Na-activated currents decay by 22% with an mean τof 28 s. Reverse currents activated upon Na removal decay with a τ of ∼15 s. The mean τ and the access resistance give a mixing volume of 10.5 pL, and the magnitudes of decaying currents in relation to peak current (0.2) indicate that Na accumulated by 24 mM. As indicted in the cartoon, calculations from Eq. 26 give a steady-state cytoplasmic Na concentration of 17 mM. The reversal potential of the veratridine-activated current indicates a steady-state cytoplasmic Na concentration of 21 mM, ∼40% greater than predicted by the simple model. (B) Using 60 mM cytoplasmic Na, Na/K pump currents decay in two distinct phases, a fast phase with a τ of ∼1 s and a slow phase with a τ of ∼17s. The veratridine-activated outward Na current is decreased by ∼40% immediately after deactivation of pump current, and it recovers with a τ of 23 s. These results project to a Na depletion of 24 mM and a mixing volume of 11.0 pL. Using the same protocol as in B, Fig. S4 describes very similar results using current–voltage relations to define the cytoplasmic Na accumulation.