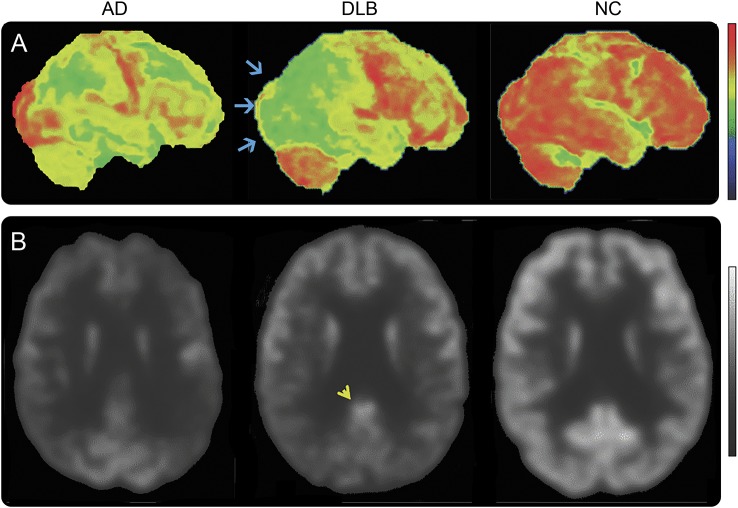
Figure 4. 18F-FDG-PET images in Alzheimer disease (AD), dementia with Lewy bodies (DLB), and normal controls (NC).
(A) Right lateral metabolic surface map projection. (B) Standard axial view transecting the posterior cingulate region. Occipital lobe metabolism is preserved in AD and NC but reduced (blue arrows) in DLB. Hypometabolism in AD is predominantly in the temporal, parietal, and frontal regions. There is normal metabolism as reflected by the normal 18F-FDG uptake (lighter shade of gray) in the posterior cingulate region (yellow arrowhead) surrounded by reduced 18F-FDG uptake (darker gray) in the adjacent occipital cortex in DLB, representing the cingulate island sign. This contrasts with the relatively reduced 18F-FDG uptake in the posterior cingulate and relatively preserved 18F-FDG uptake in the occipital cortex regions in AD. In the control, there is normal 18F-FDG uptake in the posterior cingulate, occipital, and other neocortical regions. Color and grayscale sidebars show increasing degrees of deviation from normal as the signal trends lower in the sidebars (red is normal while black is maximally abnormal in color images; white is normal while black is maximally abnormal in grayscale images). Reproduced with permission from Dr. Val Lowe, Mayo Clinic, Rochester, MN.

