Figure 2.

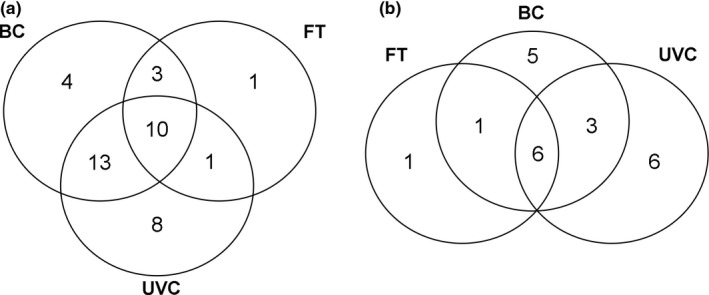
Venn diagrams showing the overlap in fish species composition recorded by the different sampling methods: Underwater visual census (UVC), baited camera (BC) and fish trap (FT) at Gran Canaria Island (a) and southern Portugal (b)

Venn diagrams showing the overlap in fish species composition recorded by the different sampling methods: Underwater visual census (UVC), baited camera (BC) and fish trap (FT) at Gran Canaria Island (a) and southern Portugal (b)