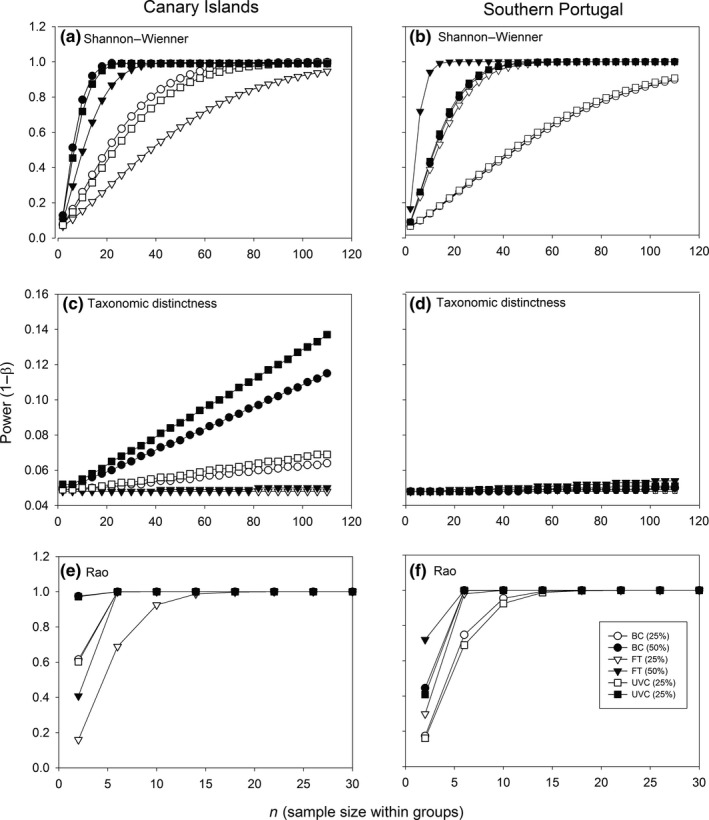
Figure 7.

Varying statistical power to a detect a change (“effect size”) of 25% and 50% for the Shannon–Wienner index (a,b), the taxonomic distinctness index (c,d), and the Rao index (e,f) at Gran Canaria Island (left column) and southern Portugal (right column), according to each sampling technique
