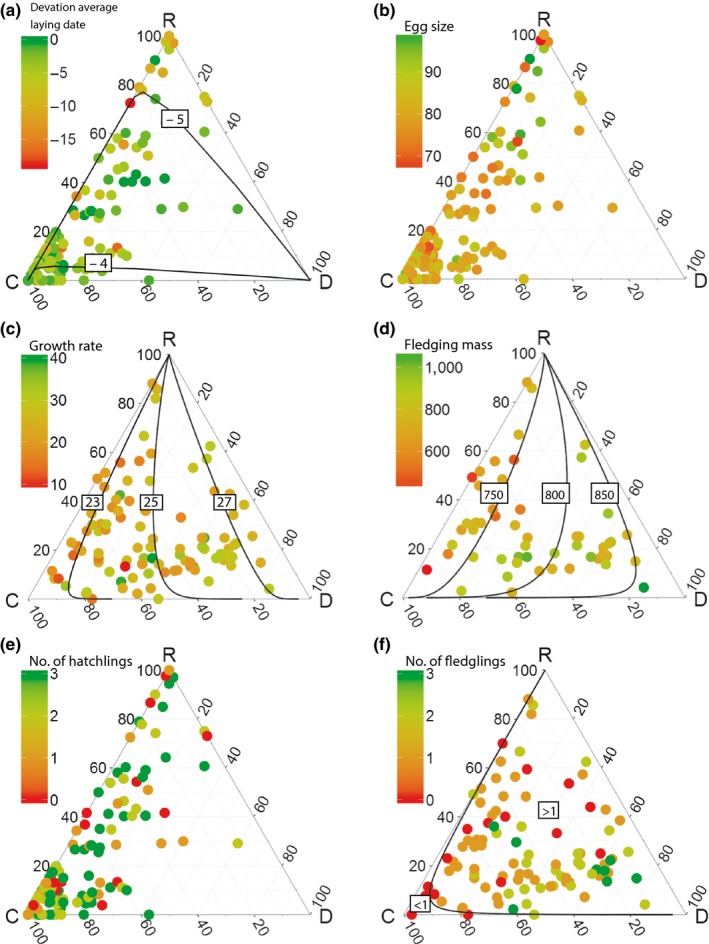
Figure 2.

Ternary diagrams that show the relationship between diet and reproductive measurements. The diet components (C, D, and R) in every corner of the diagram correspond to, respectively, “coastal bivalves,” “domestic refuse and fishery discards,” and “crustaceans and remaining prey categories.” When we found a significant relationship between diet and reproductive measurements, expected lines and values are plotted in the diagram. Figure (a), (b), and (e) is results of the egg phase while figure (c), (d), and (f) is results of the chick phase. Every point corresponds to one pair. The color of the point corresponds to the value of the response variable where green corresponds to a high value and red to a low value. Figure (a)–(f) represents diet in relation to (a) the deviation of average laying date in days where a deviation closer to zero corresponds to a more synchronized laying date. (b) Average egg size (cm3). (c) Average growth rate (g/day), (d) average fledging mass (grams), (e) hatching success (0 to three eggs hatched), and (f) fledging success (0 to three chicks fledged)
