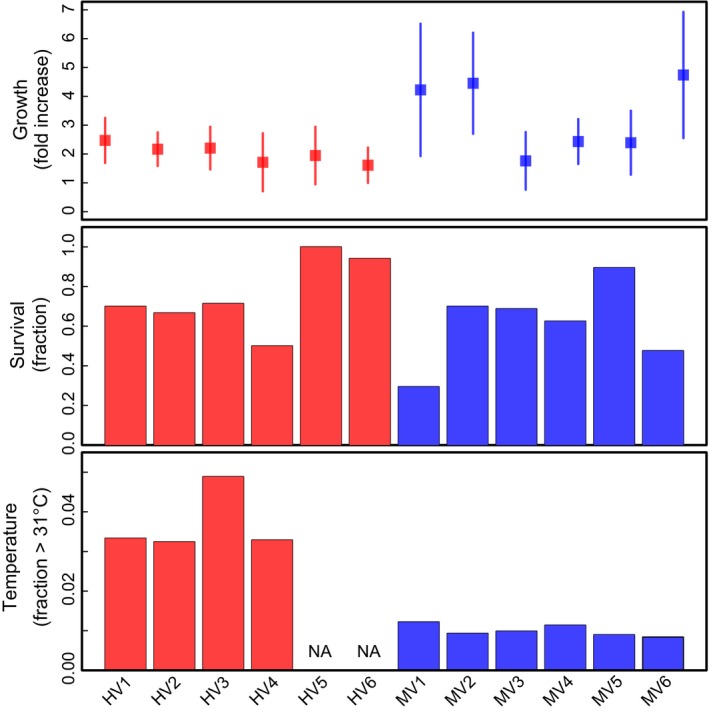
Figure 1.

Growth, survival, and temperature for each of 12 transplant crates in the highly variable (HV) and moderately variable (MV) pools. Growth is shown as mean value of percent increase in buoyant weight across individuals, and error bars represent standard deviation
