Figure 6.

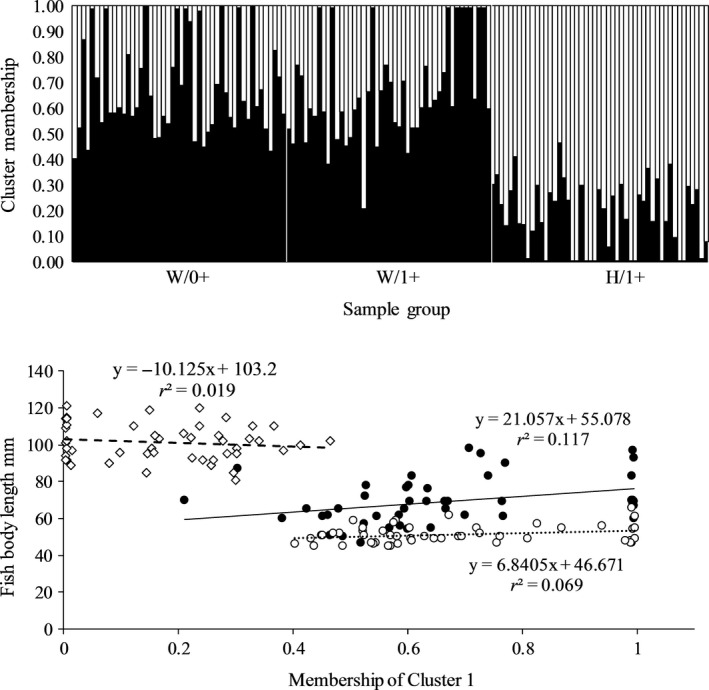
Assignment probability of individual W/0+, W/1+, and H/1+ brown trout to the two K = 2 clusters (upper panel), and the fish body length of W/0+ (○), W/1+ (●) and H/1+ (◇)_ specimens plotted as function of their membership to Cluster 1

Assignment probability of individual W/0+, W/1+, and H/1+ brown trout to the two K = 2 clusters (upper panel), and the fish body length of W/0+ (○), W/1+ (●) and H/1+ (◇)_ specimens plotted as function of their membership to Cluster 1