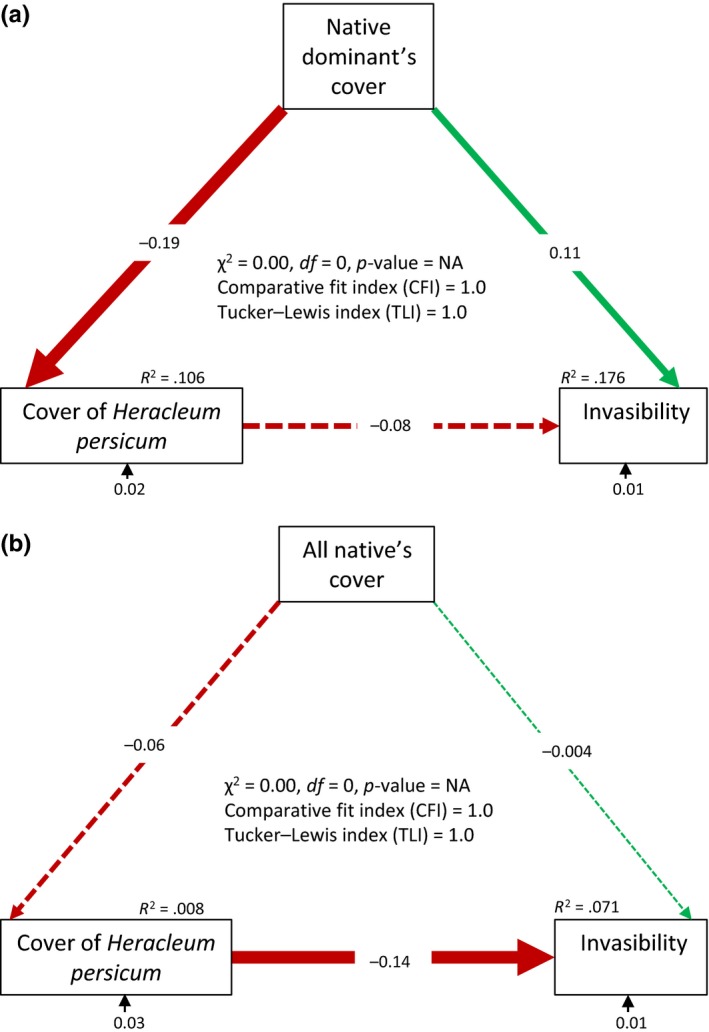
Figure 7.

Structural equation model representing relationship of Heracleum persicum cover and invasibility with cover of (a) 10 dominant native species and (b) all the native species. Zero χ2 score and degree of freedom, and comparative fit index (or Tucker–Lewis index) of 1 indicate tight model‐data fit. Solid and broken arrows indicate significant and nonsignificant relationships, respectively. The values on the arrows are standardized path coefficients indicating associations (− indicates negative association). The R 2 values are provided for response variables
