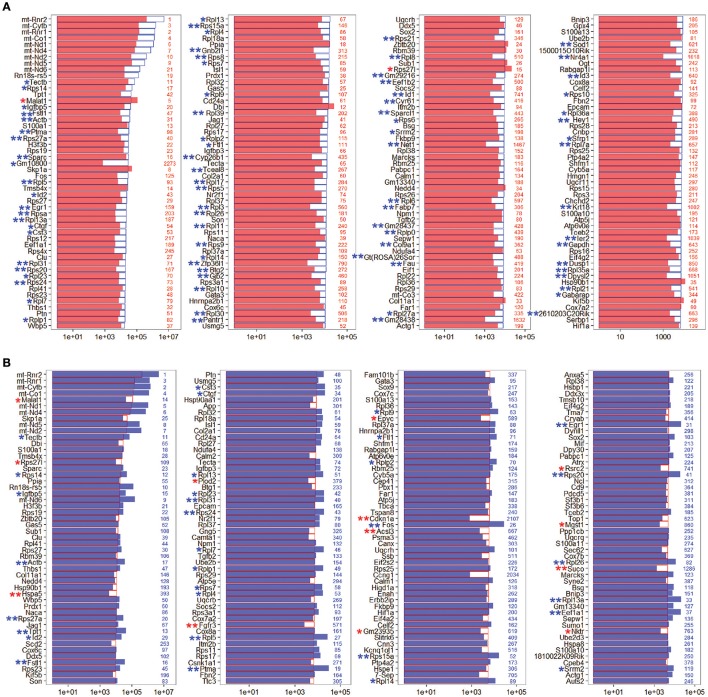
Figure 4.
Expression levels of the top 200 genes in NLPs and ULPs. (A) Expression levels of the top 200 genes in ULPs in descending order. The red numbers on the right side of each panel represent the ranking of the same genes in NLPs. (B) Expression levels of the top 200 genes in NLPs in descending order. The blue numbers on the right side of each panel represent the ranking of the same genes in ULPs. *p < 0.05, **p < 0.01.

