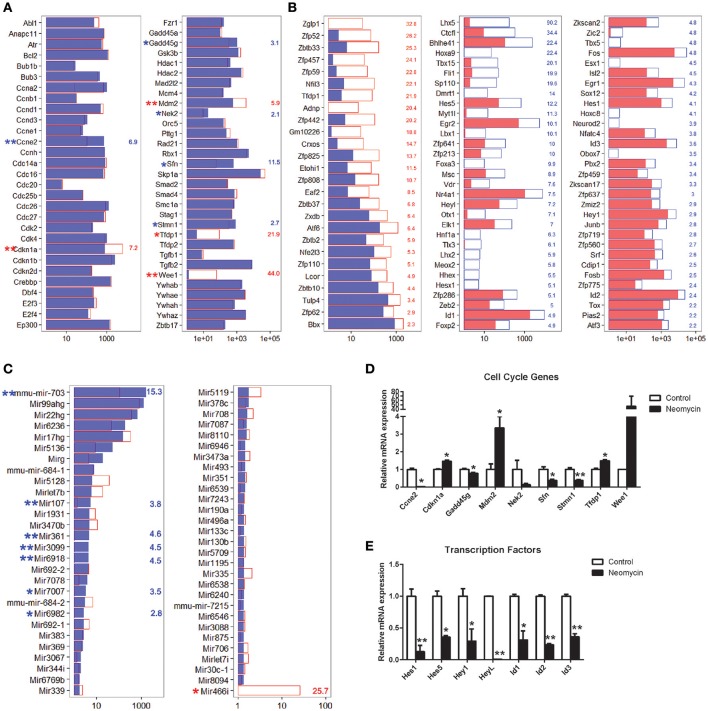
Figure 6.
Expression of cell cycle-related genes, TFs, and miRNAs. (A) Expression levels of 60 genes that are involved in cell cycle regulation. (B) Fold change expression levels of differentially expressed transcription factors in descending order. (C) Expression levels of 57 microRNAs expressed in the cochlea. In all three panels, the red and blue numbers separately represent the fold change in upregulated and downregulated gene expression in NLPs compared to ULPs. *p < 0.05, **p < 0.01. (D) Real-time PCR analysis of the cell cycle genes. (E) Real-time PCR analysis of the TFs reported in the inner ear. *p < 0.05, **p < 0.01. n = 3.

