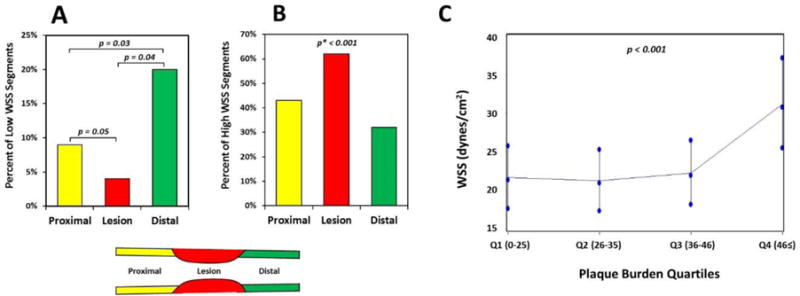
Figure 3.

A) Percent of segments with low WSS (<10 dynes/cm2) within the lesions and proximal to and distal to lesions. B) Percent of segments with high WSS (≥25 dynes/cm2) within the lesions and proximal to and distal to lesions (*P value: the GLIMMIX procedure in SAS did not converge when fitting the statistical model for Figure 3B. Convergence was achieved when lesion and distal were consolidated into one category). C) Association between WSS and quartiles of plaque burden. The range of plaque burden in each quartile is shown in brackets (Error bars are 1 standard error). WSS: wall shear stress (from Eshtehardi et al. [34]).
