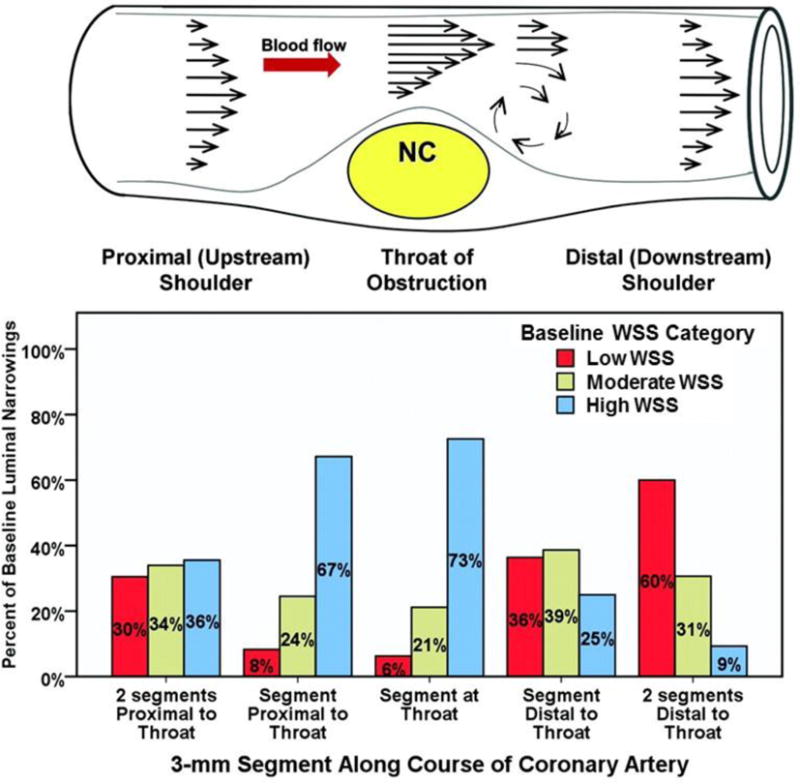
Figure 4.

Baseline WSS patterns along the course of a coronary artery obstruction. The 3 WSS categories (low <10 dynes/cm2; moderate, 10–17 dynes/cm2; high >17 dynes/cm2) in the bar graph were derived from the terciles of the WSS frequency distribution in 3-mm segments. NC: necrotic core; WSS: wall shear stress (modified from Stone et al. [36] with permission).
