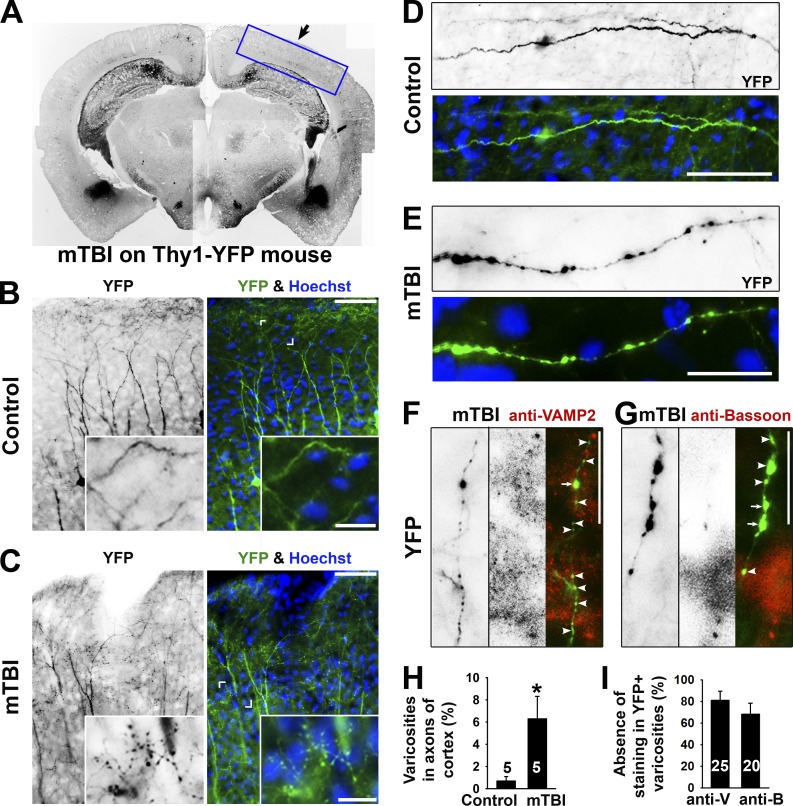
Figure 2.
Axonal varicosity induction in a repetitive closed-skull mTBI mouse model. (A) Low-magnification image of a coronal section from the brain of a Thy1-YFP transgenic mouse that had received impact on the right side. YFP fluorescent signals are inverted. This is a compilation of multiple images. The boxed area indicates the brain region that this study focused on. The black arrow indicates head impact location. (B) YFP+ dendrites and axons in the cortex of a control mouse. The apical dendrites of layer V projection neurons in the cortex point in the upward direction. (C) YFP+ dendrites and axons in the cortex of an mTBI mouse. Cornered areas are provided in the insets to show normal axons (B) and axons with clear varicosities (C). (D) A normal axonal segment from a control mouse. (E) An axonal segment with many varicosities from an mTBI mouse. YFP is in green, and nuclear dye Hoechst is in blue in merged images. (F and G) Partial colocalization of axonal varicosities (left gray images; green in the merged images) with presynaptic markers (middle gray images; red in the merged images) in VAMP2 (F) and Bassoon (G) from mTBI mice. Arrows indicate axonal varicosities (indicated by YFP) containing a presynaptic marker (indicated by anti-VAMP2 or anti-Bassoon staining), and arrowheads indicate axonal varicosities without presynaptic markers. Bars: (B and C, main images) 100 µm; (B and C, insets) 30 µm; (D–G) 20 µm. (H) Percentages of axons with clear varicosities in control and mTBI mice. (I) Percentages of varicosities in axons from mTBI mice without costaining of the presynaptic markers. Error bars indicate means ± SEM. Unpaired t test: *, P < 0.05. anti-B, anti-Bassoon; anti-V, anti-VAMP2.

