Figure 5.
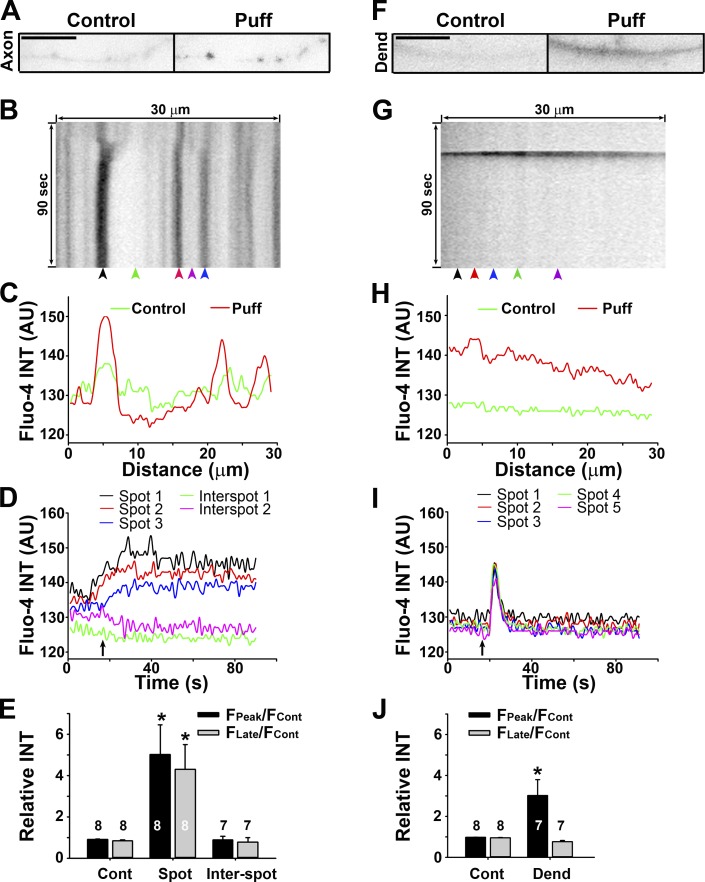
Sustained Ca2+ increase in axonal varicosities induced by mechanical stress. (A) An axonal segment before (0 s; control) and after (50 s; Puff) puffing. Signals are inverted. (B) Kymograph of Fluo-4 fluorescence along the axonal segment in A. (C) Fluorescence profiles along the axonal segment at two time points in A. (D) Fluorescence intensities (INT) over time at five different locations indicated by arrowheads in B. (E) Summary of intensity changes of Fluo-4 fluorescence without (Cont) and with (Spot, in a varicosity; Inter-spot, between varicosities) puffing. (F) A dendrite before (0 s) and after (25 s) puffing. Bars, 10 µm. (F) Kymograph of Fluo-4 fluorescence along the dendrite in F. (H) Fluorescence profiles along the dendrite at two time points in F. (I) Fluorescence intensities over time at five different locations indicated by arrowheads in G. (J) Summary of intensity changes of Fluo-4 fluorescence without and with (Dend) puffing. Fcont, fluorescence intensity before puffing; FPeak, the maximal fluorescence intensity reached during puffing; FLate, fluorescence intensity at 80 s; arrows, the puffing onset. Background was not subtracted in C, D, H, or I. Background was subtracted in E and J. Error bars indicate means ± SEM. A one-way ANOVA followed by Dunnett's test was used in E and an unpaired t test was used in J. *, P < 0.05.

