Figure 7.
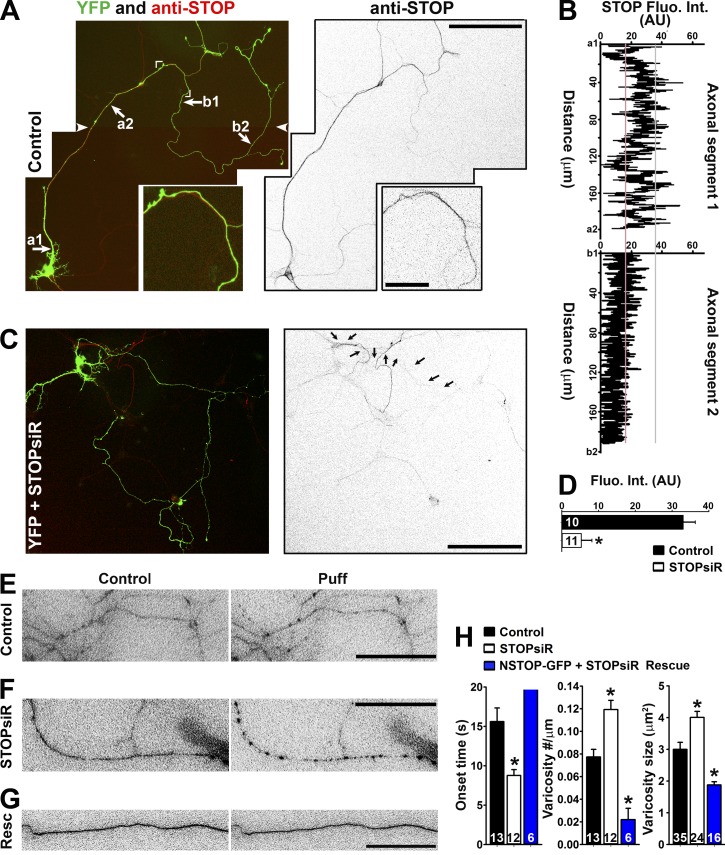
Axonal distribution of STOP and its knockdown on varicosity formation. (A) Endogenous STOP (red in merged image on the left; inverted grayscale on the right) expression from neurons at 10 DIV. Cornered area, enlarged (2.5-fold) bottom panels. White arrowheads show the montage line of two overlapping images. (B) STOP fluorescence intensities along two labeled axonal segments in A. (C) Significant reduction of STOP in the neuron transfected with STOP siRNA (siR). Arrows indicate the axon of the transfected neuron. (D) Summary of the effect of STOP siRNA knockdown along middle axons. Mean fluorescence intensity was measured from a segment of middle axons from control (black bar) and STOPsiR (open bar) neurons. Unpaired t test: *, P < 0.05. (E) Middle axons transfected with YFP and control siRNA were puffed. YFP signals were inverted. (F) A middle axon transfected with YFP and STOP siRNA was puffed. (G) A middle axon transfected with NSTOP-GFP (rat) and STOP siRNA was puffed. Resc, Rescue. (H) Summary of the puffing results for the effects of STOP siRNA on onset (left), varicosity number (middle), and size (right). Mouse hippocampal neurons were cultured from mouse pups at P0–P2. Error bars indicate means ± SEM. One-way ANOVA followed by Dunnett's test: *, P < 0.05. Bars: (A [main images] and C) 100 µm; (A, inset) 20 µm; (E–G) 15 µm.

