Figure 5.
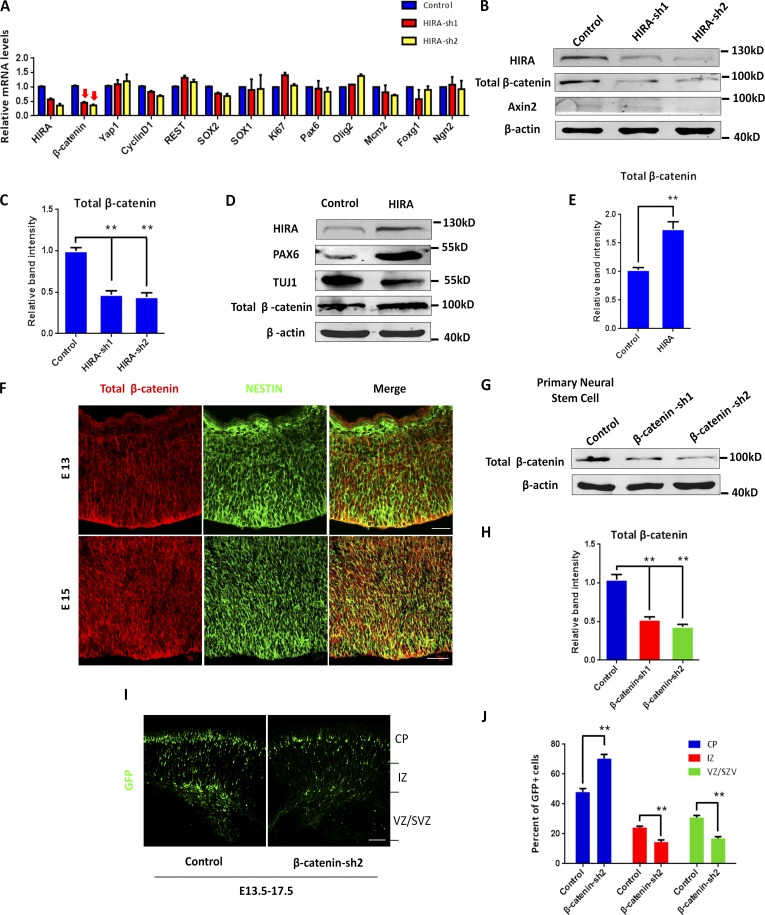
HIRA regulates β-catenin levels. (A) RT-PCR analysis of the relative mRNA levels of several markers related to proliferation and differentiation when HIRA is silenced. The arrows indicate the decrease in β-catenin expression levels when HIRA is knocked down. (B and C) Western blot analysis of the protein levels of total β-catenin and Axin2 in HIRA-silenced NPCs. The empty control shRNA was used as a control. The bar graph shows the relative band intensity of total β-catenin. β-Actin was used as a loading control (n = 3; mean ± SEM; *, P < 0.05; **, P < 0.01; t test, two sided). (D and E) Western blot analysis of the protein levels of total β-catenin, PAX6, and TUJ1 in HIRA-overexpressing NPCs. The empty control expression vector was used as a control. The bar graph shows the relative band intensity of total β-catenin. β-Actin was used as a loading control (n = 3; mean ± SEM; **, P < 0.01; t test, two sided). (F) E13 and E15 embryonic brain sections were costained with anti–β-catenin and anti–NESTIN antibodies (VZ/SVZ). Bars: (E15) 25 µm; (E13) 50 µm. (G and H) Cultured NPCs were infected with control or β-catenin shRNA lentivirus, and total β-catenin protein levels were then analyzed using Western blot. The empty control shRNA was used as a control. The bar graph shows the relative band intensity of total β-catenin. β-Actin was used as a loading control (n = 3; mean ± SEM; **, P < 0.01; t test, two sided). (I and J) β-Catenin knockdown leads to changes in GFP-positive cell distribution in the cortex. β-Catenin shRNA or control plasmids were electroporated into E13.5 embryonic mouse brains, and embryos were sacrificed at E17.5 for phenotypic analysis. The percentage of GFP-positive cells in each region is shown (n = 3; mean ± SEM; **, P < 0.01; t test, two sided). Bar, 50 µm.

