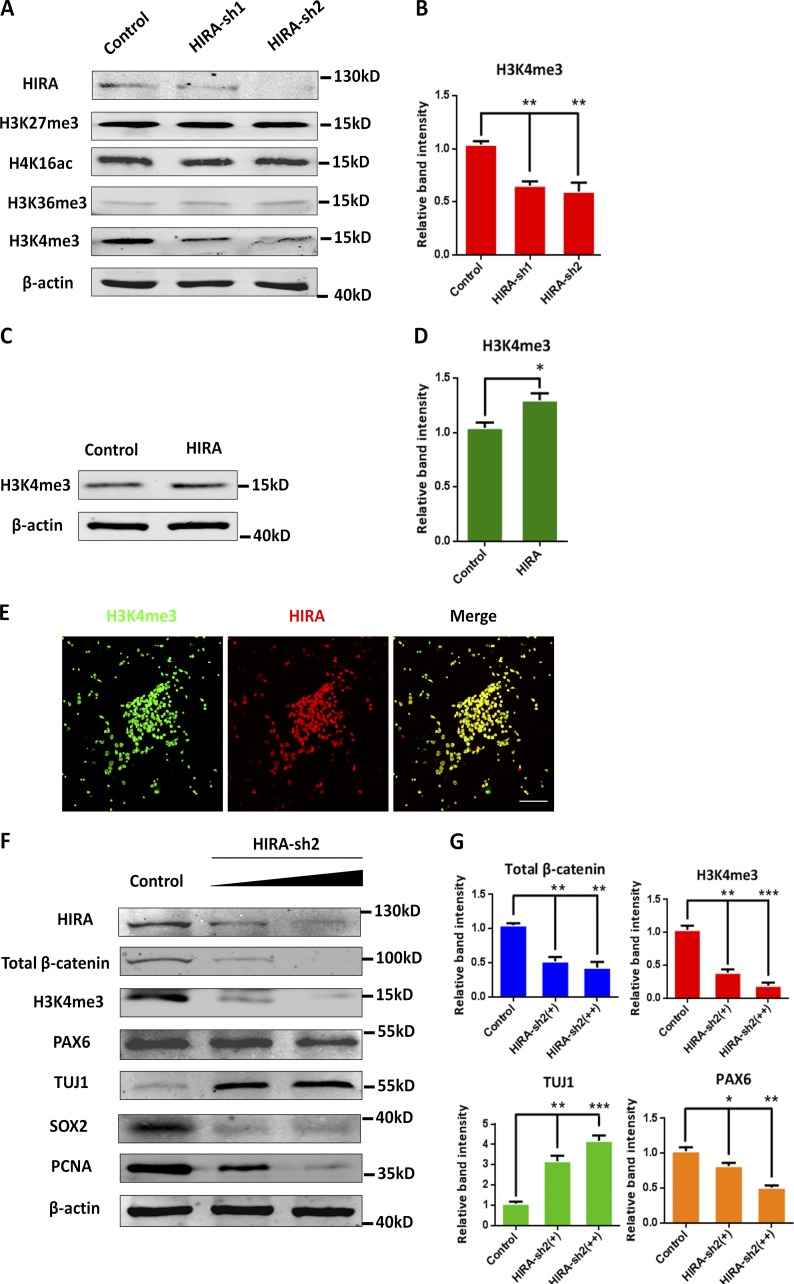
Figure 8.
HIRA knockdown reduces H3K4me3 levels. (A and B) Expression of H3K4me3 is obviously reduced when HIRA is knocked down. Western blot analysis of the protein levels of H3k27me3, H4k16ac, H3k36me3, and H3K4me3 in HIRA-silenced NPCs. The empty control shRNA was used as a control. The bar graph shows the relative band intensity of H3K4me3. β-Actin was used as a loading control (n = 3; mean ± SEM; **, P < 0.01; t test, two sided). (C and D) Western blot analysis of the protein levels of H3K4me3 in HIRA-overexpressing NPCs. The control expression vector was used as a control. The bar graph shows the relative band intensity of H3K4me3. β-Actin was used as a loading control (n = 3; mean ± SEM; *, P < 0.05; t test, two sided). (E) H3K4me3 and HIRA colocalize in NPCs. Cultured NPCs were costained with anti–H3K4me3 and anti–HIRA antibodies. Bar, 25 µm. (F and G) Western blot analysis of the protein levels of total β-catenin, H3K4me3, PAX6, TUJ1, SOX2, and PCNA with gradually increasing transfection amounts of HIRA-sh2 (0 µg, 0.5 µg, and 1.5 µg). The bar graph shows the relative band intensity of total β-catenin, H3K4me3, TUJ1, and PAX6. β-Actin was used as a loading control (n = 3; mean ± SEM; *, P < 0.05; **, P < 0.01; ***, P < 0.001; t test, two sided).

