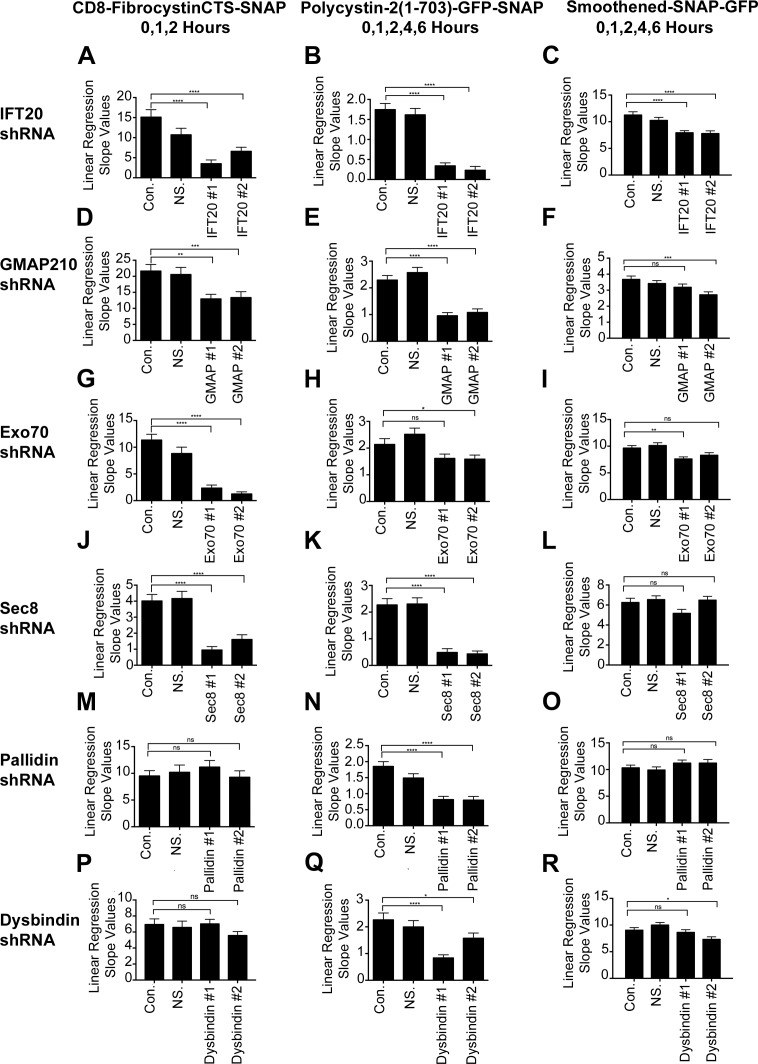
Figure 2.
Fibrocystin, polycystin-2, and smoothened trafficking rates to the primary cilium. (A–C) Linear regression slope value analysis of newly synthesized CD8-FibrocystinCTS-SNAP, Polycystin-2-GFP-SNAP, or Smoothened-SNAP-GFP trafficking from the Golgi apparatus to the primary cilium when IFT20, GMAP210 (D–F), Exo70 (G–I), Sec8 (J–L), pallidin (M–O), or dysbindin (P–R) is knocked down using lenti-shRNAs. Linear regression analysis of newly synthesized membrane protein delivery to the cilium was performed on selected time points: 0, 1, and 2 h for CD8-fibrocystinCTS-SNAP; 0, 1, 2, 4, and 6 h for polycystin-2-GFP-SNAP; and 0, 1, 2, 4, and 6 h for smoothened-SNAP-GFP. The time points were chosen by determining which data points remained linear before (or if) reaching a plateau in the control groups (Fig. 1; and Figs. S2, S3, and S4). The slope values obtained from this analysis represent the trafficking rates of newly synthesized membrane protein delivery to the cilium. Slope values between control and experimental shRNA groups were compared with one another to determine statistical significance. shRNAs of interest are listed vertically on the left side, and their corresponding membrane proteins are listed horizontally. Error bars represent SEM. *, P < 0.05; **, P < 0.01; ***, P < 0.001; ****, P < 0.0001. The IFT20 shRNA linear regression analysis (A–C) from Fig. 1 is shown again for completion.

