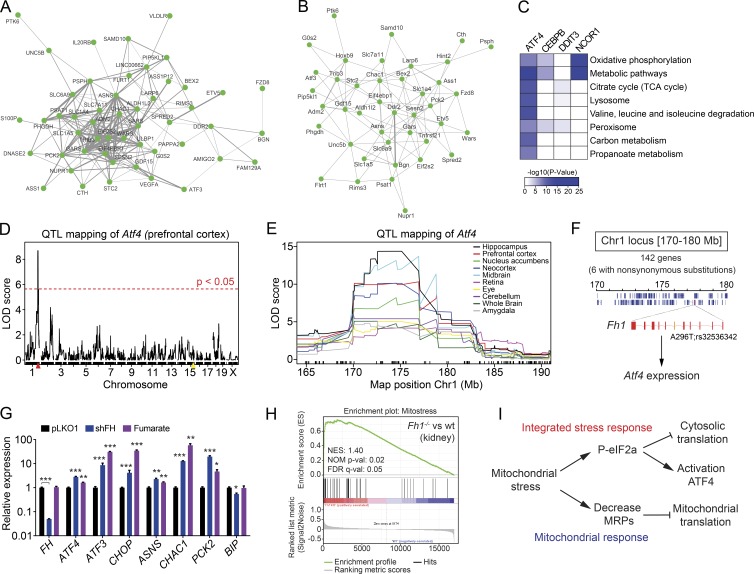
Figure 9.
Genetic link of ATF4 and mitochondrial stress in human and mouse populations. (A and B) Multitissue correlation network analysis of transcript levels across (A) 49 human tissues in GTEx and (B) 16 mouse tissues in the BXD genetic reference population. Nodes represent the transcripts and the width of the ties among nodes indicate the probability to show a significant positive correlation in all tissues analyzed. The human network shows a tighter clustering likely caused by the higher number of tissues and samples per tissues. (C) Heatmap representing the KEGG pathway analysis of the top negative-correlated genes across 49 tissues using GTEx data for ATF4, CEBPB, DDIT3/CHOP, and NCOR1 (used as positive control). Color key represents the negative logarithm base 10 of the p-value of each pathway obtained in the analysis. (D) Expression quantitative trait locus (eQTL) analysis of Atf4 transcript level in the prefrontal cortex. The yellow mark represents the Atf4 gene locus on chromosome 15, whereas the red mark represent the position of a trans-eQTL for Atf4 expression levels on chromosome 1 (Chr1). (E) eQTL mapping of Atf4 transcript levels across several tissues identifies a common and strong trans-eQTL on chromosome 1 (170–180 Mb). (F) Representation of the chromosome 1 locus (170–180 Mb) containing 142 genes, 6 of which have nonsynonymous substitutions, and only one gene, Fh1, encodes a mitochondrial protein. Fh1 contains a nonsynonymous sequence variant (A296T; rs32536342) that segregates in the BXDs. This sequence variant regulates the expression levels of Fh1, which in turn regulates Atf4 expression. (G) mRNA expression analysis of HeLa cells after knockdown of fumarate hydratase (shFH) and treatment with monomethyl fumarate at 2.5 mM for 24 h. Data are presented as mean ± SEM; *, P < 0.05; **, P < 0.01; ***, P < 0.001. (H) Enrichment score plot from GSEA using microarray data from renal cysts of mice with renal tubule specific inactivation of Fh1 (Fh1−/−; GSE29988). The list of mitochondrial stress genes (mt-stress genes; Table S5) was used as the gene set of interest. FDR q-val: false discovery rate adjusted p-value; NES, normalized enrichment score; NOM p-val, nominal p-value. (I) Scheme summarizing our working hypothesis. Mitochondrial stress stimulates the phosphorylation of the eIF2α, which inhibits cytosolic translation and activates the ATF4 pathway. At the same time, mitochondrial stress also reduces the expression of MRPs to inhibit mitochondrial translation and protect mitochondrial function.

