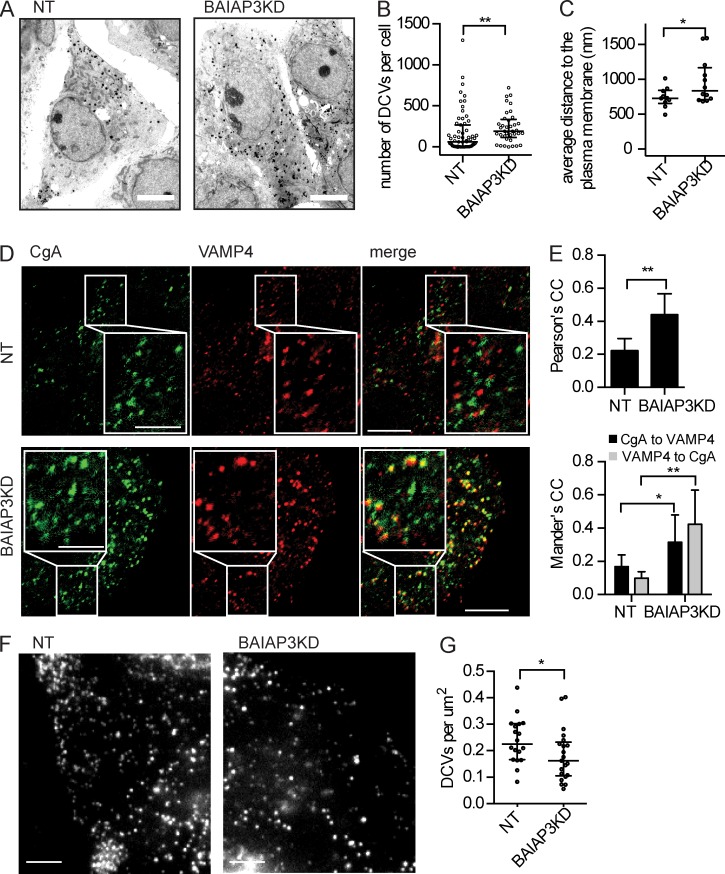
Figure 3.
Accumulation of defective DCVs in BON cells. (A) Electron microscopy micrographs of BON cells. Bars, 5 µm. (B) Number of DCVs per electron microscopy section. n = 63 nontargeting (NT) and 37 knockdown (KD) cells. (C) Distance of DCVs to the cell border. n = 10 nontargeting and 12 knockdown cells. (D) Immunofluorescent staining of CgA and VAMP4. Bars: 10 µm; (inset) 5 µm. (E) Colocalization analysis of CgA and VAMP4. n = 8. CC, correlation coefficient. (F) NPY-Venus+ DCVs in the TIRF field. Bar, 5 µm. (G) Number of DCVs per square micrometer in the TIRF field. n = 18 nontargeting and 21 knockdown. See also Fig. S3. (B, C, and G) Data are expressed as median ± quantile. P-values were obtained by Wilcoxon test. (E) Data are expressed as mean ± SD. P-values were obtained by a two-tailed Student’s t test. *, P < 0.05; **, P < 0.01.

