Figure 5.
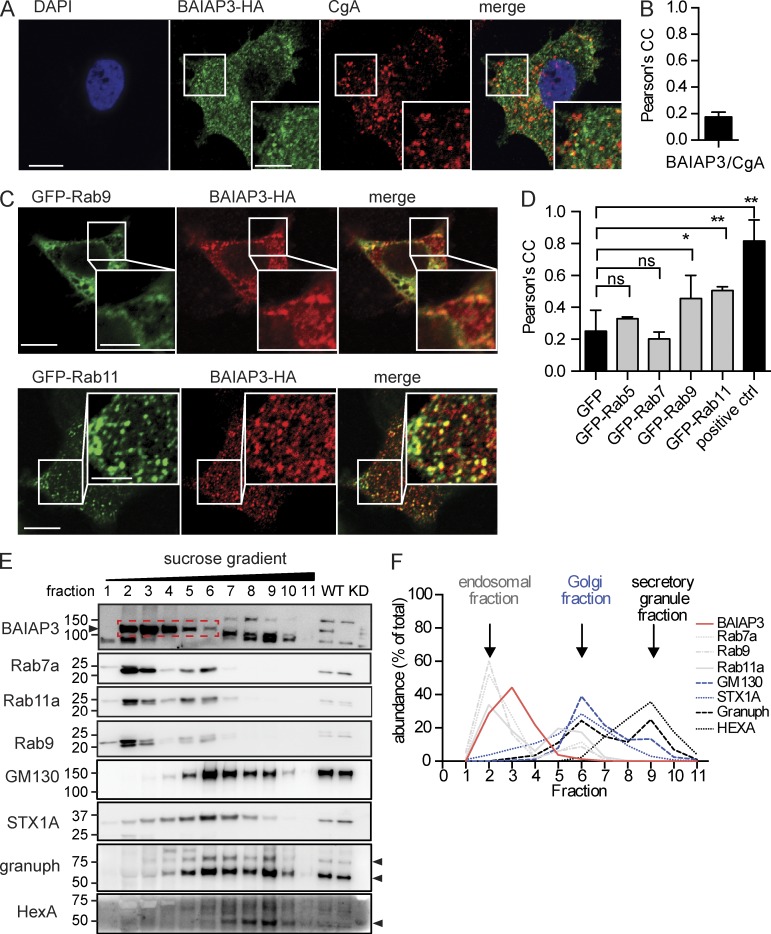
BAIAP3 localization to endosomes. (A) Coimmunofluorescent staining of BAIAP3-HA and DCV marker CgA. (B) Colocalization analysis of BAIAP3-HA and CgA. n = 6 regions. (C) Immunofluorescent staining of BAIAP3-HA in cells expressing GFP-Rab9 or -Rab11. (A and C) Bars: 10 µm; (inset) 5 µm. (D) Colocalization analysis of BAIAP3-HA and Rabs. GFP is used as the negative control, and the self-colocalization of Rab7 (GFP and mCherry tagged) is the positive control (ctrl). n = 9, 3, 7, 7, 4, and 8 regions. (E) INS-1 cell fractionation and equilibrium centrifugation on sucrose gradient (0.27–2 M). WT and BAIAP3 knockdown cell lysates were loaded as the control in the last two lanes. granuph, granuphilin. Arrowheads indicate expected bands for the corresponding blot. BAIAP3 bands are also circled in the red dashed box. Molecular mass is shown in kilodaltons. (F) Distribution of organelle markers in the sucrose gradient. Each line corresponds to the respective blot shown in E. See also Fig. S4. Data are expressed as mean ± SD. P-values were obtained by a two-tailed Student’s t test. *, P < 0.05; **, P < 0.01.

