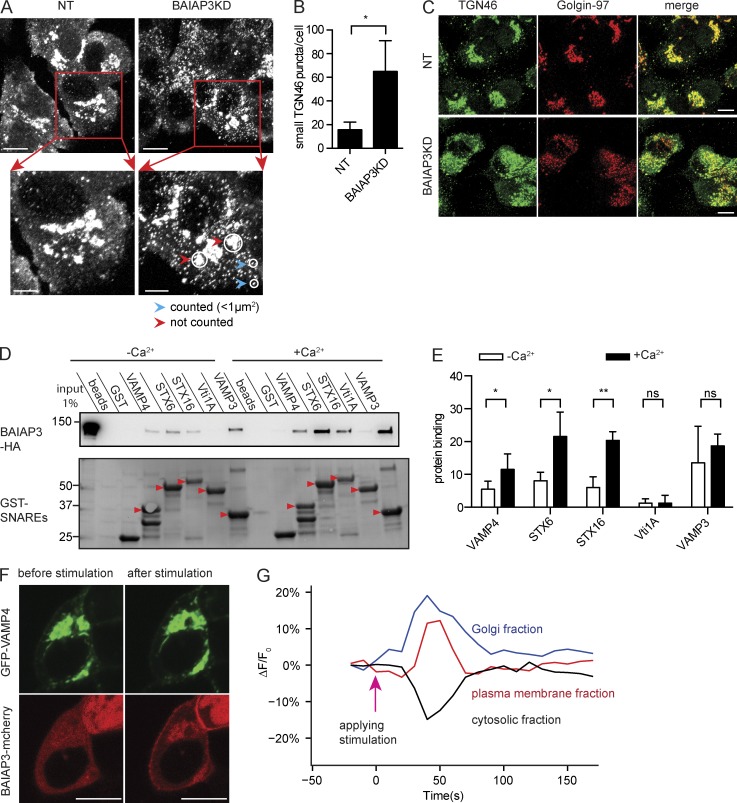
Figure 6.
BAIAP3 functions in retrograde trafficking. (A) Representative images of TGN46 in BON cells. Bars: 10 µm; (inset) 5 µm. BAIAP3KD, BAIAP3 knockdown; NT, nontargeting. (B) Quantification of small puncta of TGN46. n = 4. (C) Coimmunofluorescent staining of TGN46 and Golgin-97. Bar, 10 µm. (D) GST pulldown of BAIAP3-HA from BON cell lysates by immobilized cytosolic domains of SNAREs in the presence of 100 µM Ca2+ or 1 mM EGTA/EDTA. Arrowheads indicate the expected protein bands. Molecular mass is shown in kilodaltons. (E) Ca2+-enhanced pulldown by different SNAREs. Protein binding is determined by normalizing the density of each BAIAP3-HA band to total BAIAP3-HA pulled down by all SNAREs within one experiment. n = 6. (F) Ionomycin stimulation induced BAIAP3 recruitment to the TGN and the plasma membrane in BON cells coexpressing BAIAP3-mCherry and GFP-VAMP4. See also Video 1. Bars, 10 µm. (G) Quantification of BAIAP3 partition in response to ionomycin stimulation. See also Figs. S5 and S6. Data are expressed as mean ± SD. P-values were obtained by a two-tailed Student’s t test. *, P < 0.05; **, P < 0.01.

