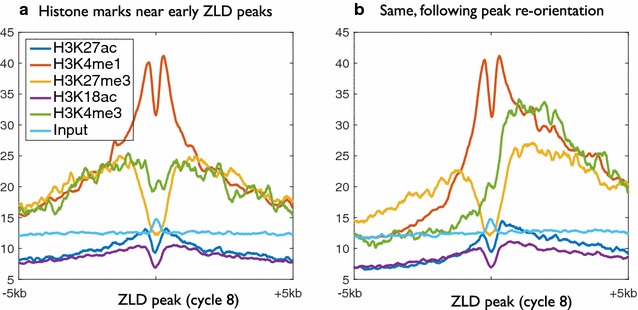
Fig. 3.

Chromatin marks surrounding Zelda peaks prior to and following peak re-orientation. a Average chromatin marks at mitotic cycle 14, from Li et al. [5], centered on 2000 early Zelda peaks (cycle 8). Clearly visible are relative enrichment near Zelda site for the enhancer mark H3K4me1 (orange) and depletion of the repressive H3K27me3 (yellow). b Same, following re-orientation of Zelda peaks based on all five modifications
