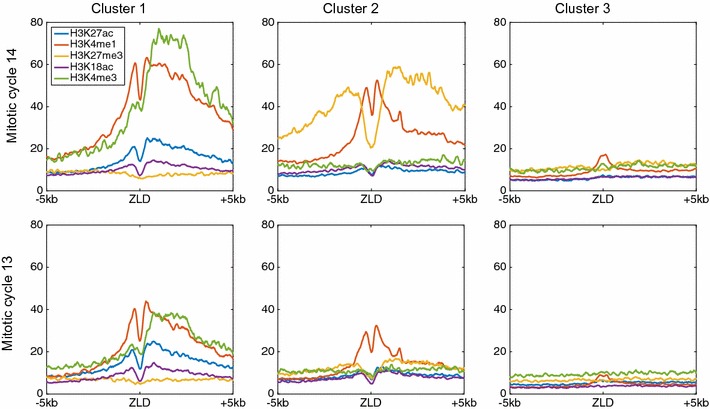
Fig. 4.

Spectral clustering of chromatin signatures for top 2000 early Zelda sites. Cluster 1 (left) is composed of 620 early Zelda peaks, with an average chromatin signal of asymmetric H3K4me3 with H3K4me1 mark (promoter-like signature). Cluster 2 includes 660 early Zelda peaks and shows symmetric signature of two flanking H3K4me1 nucleosomes, within a larger H3K27me3 region. Cluster 3 (right) includes 720 Zelda peaks and is characterized by almost no modifications. Top row chromatin data from mitotic cycle 14; bottom mitotic cycle 13
