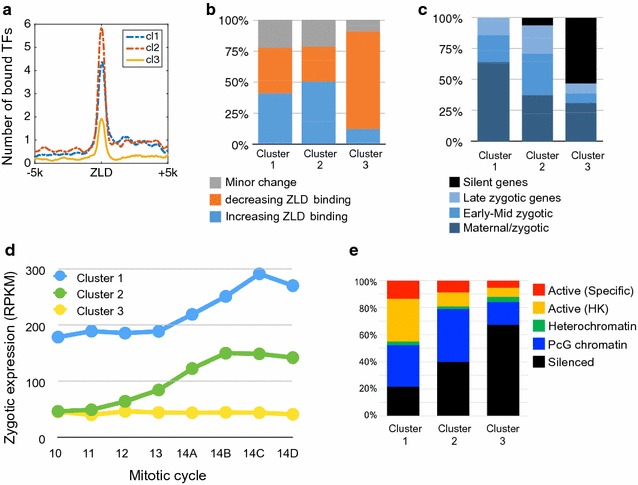
Fig. 5.

Biological characteristics of the three clusters. a By examining the binding of 17 anterior–posterior and dorsal–ventral transcription factor (TFs) in early fly development, we calculated the average number of TFs bound for each locus with each cluster [13]. Early Zelda peaks in clusters 1 and 2 seem to be bound (by the end of mitotic cycle 14) by >4 and ~6 factors, respectively, compared to <2 factors bound near early Zelda peaks in cluster 3. b Analysis of temporal dynamics in Zelda binding [16]. In clusters 1 (left) and 2 (center), about 37% of the ZLD peaks are increasing, 40% decreasing, and ~20% show minor changes in peak height. In contrast, 79% of cluster 3 regions (right) show reduced ZLD binding. c By associating each Zelda site locus to the nearest TSS, we show that cluster 1 peaks are mostly associated with maternally deposited genes that are also transcribed in early developmental stages (“maternal/zygotic,” e.g., house-keeping genes). Cluster 2 is more associated with zygotically transcribed genes, while cluster 3 is mostly not expressed [30]. d Average expression levels [30] for gene associated with clustered Zelda peaks, at eight time points throughout MZT. e Different chromatin patterns as annotated into five chromatin types using HMM with 53 chromatin proteins in Drosophila Kc167 cells [21]. Types include tissue-specific active genes (red), “house-keeping”-like active genes (yellow), and heterochromatin (green), polycomb-related (blue) or silenced genomic regions (black)
