
Fig. 5.
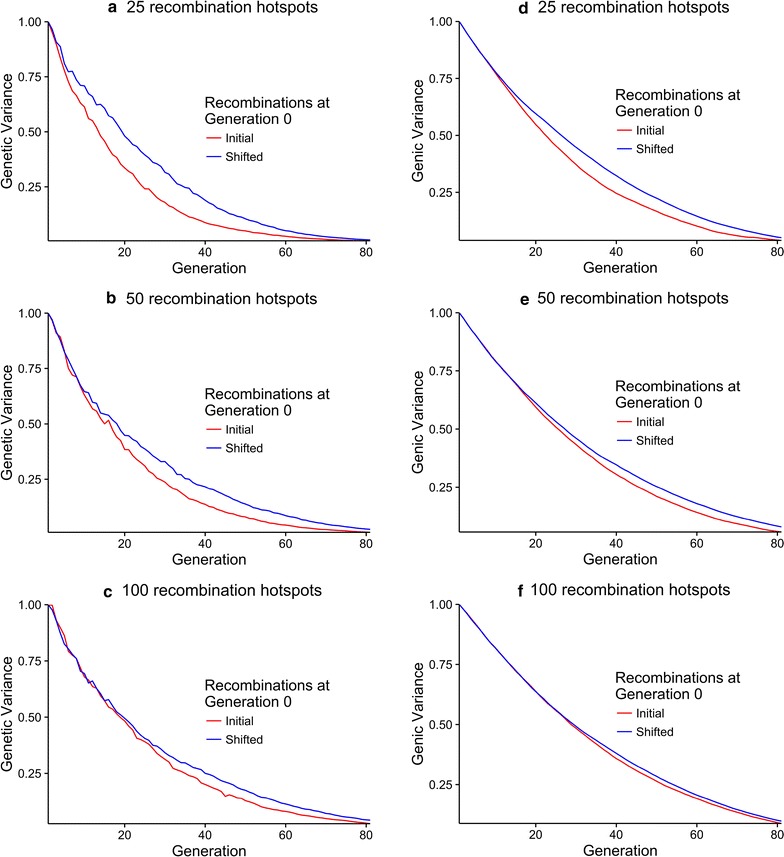
Genetic variance (panels a, b, c) and genic variance (panels d, e, f) against time for generations 0 to 80 when the number of recombination hotspots was 25 (panels a and d), 50 (panels b and e) and 100 (panels c and f). The red lines show when recombination hotspots were kept constant and the blue lines show when they were shifted