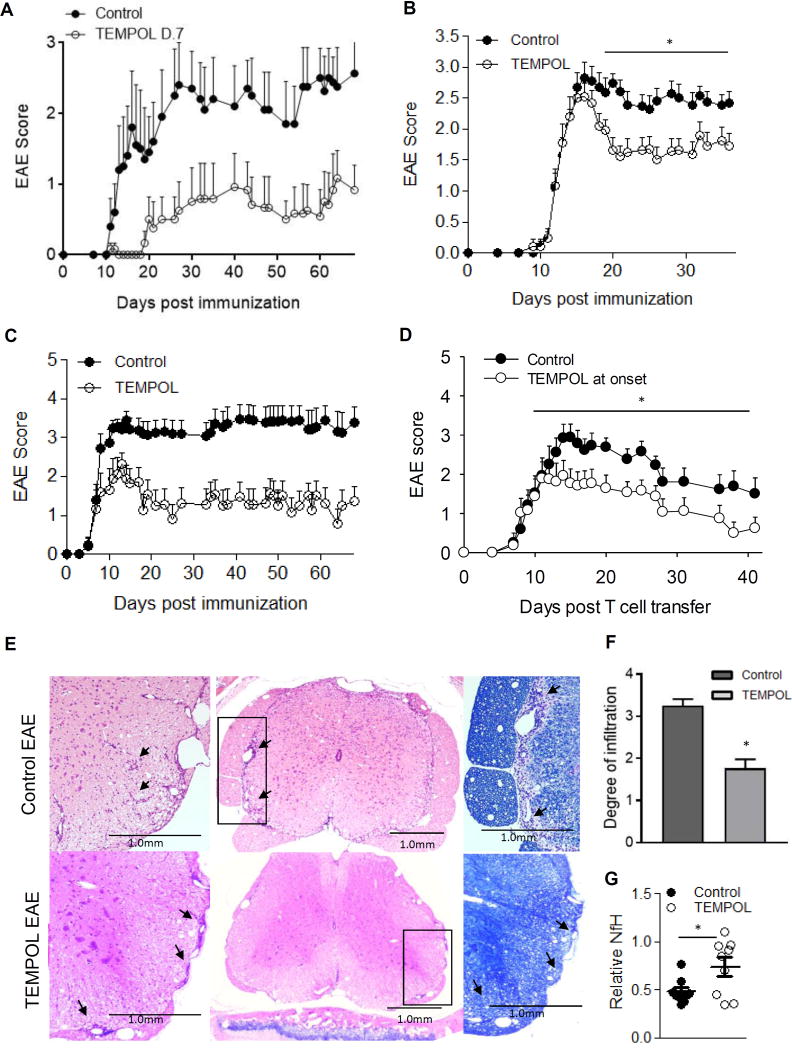
Figure 5. TEMPOL administration limits clinical disease in both active and passive models of EAE.
Actively-induced EAE C57BL/6J mice initiated TEMPOL-chow at (A) 7 days post immunization. The average disease severity and peak disease severity were both significantly reduced in TEMPOL-fed animals. N = 6 animals per group, points represent the average disease severity with error bars ±SEM; 1 of 3 representative experiments. (B) TEMPOL administration after the onset of clinical symptoms (limp tail or greater in >60% of mice (day 14 post immunization) reduced disease severity. n = 17 mice per group, 1 of 3 representative experiments is shown. Values shown correspond to the mean ± SEM. (C) Two weeks of TEMPOL-chow prior to the transfer of encephalitogenic T cells reduced incidence and severity of disease. TEMPOL administration (○) or control chow (●). Data points represent the average clinical disease score ±SEM with n = 10 per group. 1 of 3 representative experiments is shown. (D) Passively induced EAE in SJL animals was treated with control or TEMPOL chow at the onset of symptoms (day 10). Bars represent the average of n = 13 and 12 for control and TEMPOL groups respectively, ±SEM. Average disease severity was significantly different over the time from disease onset to study end. *p = 0.026 Mann-Whitney rank sum test. Infiltrates in animals from (C) were reduced in TEMPOL versus control-fed animals (E,F). SJL/J animals induced for passive EAE were examined at peak disease (day 18) for assessment of inflammatory infiltrates. Animals on control chow were compared to animals on TEMPOL chow for two weeks prior to T cell transfer. Spinals cords from four animals per group were examined at nine similar levels spanning the entire cord and scored as outlined in Material & Methods. The scores from each animal were pooled and the two groups compared by unpaired t-test. Bars represent the average of n = 36 levels per group ± SEM. *p = 0.03. Furthermore, regions of myelin pallor (as shown by reduced luxol fast blue staining) were typically not observed in TEMPOL-fed animals. (G) TEMPOL administration reduces the degree of neuronal loss or damage. Spinal cord neurofilament levels were measured in spinal cord homogenates from control EAE or TEMPOL-fed EAE mice in (C) by ELISA for neurofilament H. Results represent the mean relative healthy phosphorylated or heavy neurofilament levels (n = 9 per group) ±SEM, *p = 0.03 when TEMPOL (filled bars) were compared with control (open bars) EAE animals.

