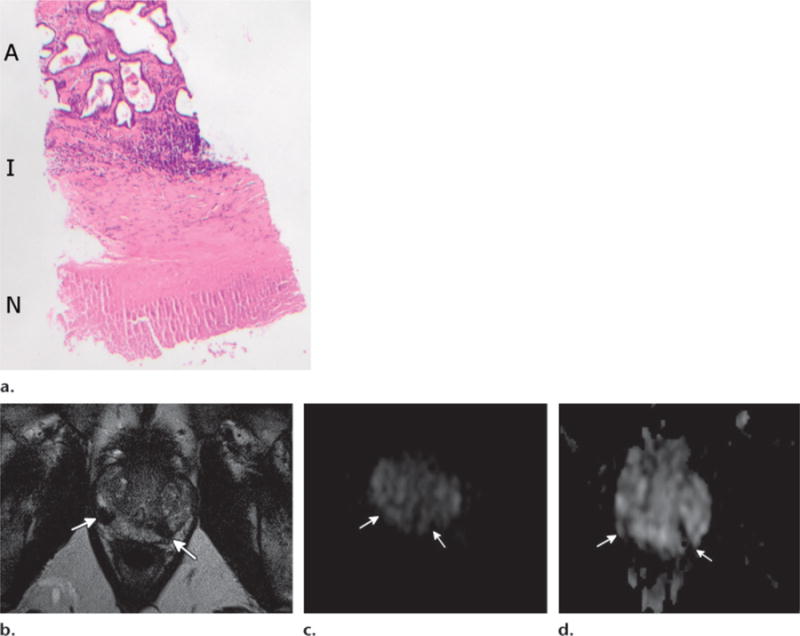
Figure 10.

Prostatic necrosis and atrophy in a 58-year-old man with bacillus Calmette-Guérin vaccine–related granulomatous prostatitis 3 years earlier with subsequent treatment but ongoing elevation of PSA level. MR imaging–guided biopsy showed necrosis and atrophy. (a) Low-power photomicrograph shows a zonation effect of central necrosis (N), peripheral inflammatory infiltrate (I), and atrophy (A). (Original magnification, ×10; H-E stain.) (b–d) Axial T2-weighted image (b), axial high-b-value DW image (c), and axial ADC map (d) show two areas of markedly low T2 signal intensity in the peripheral zone (arrows). These areas have low signal intensity on the high-b-value DW image, low ADC, and nonenhancement (not shown).
