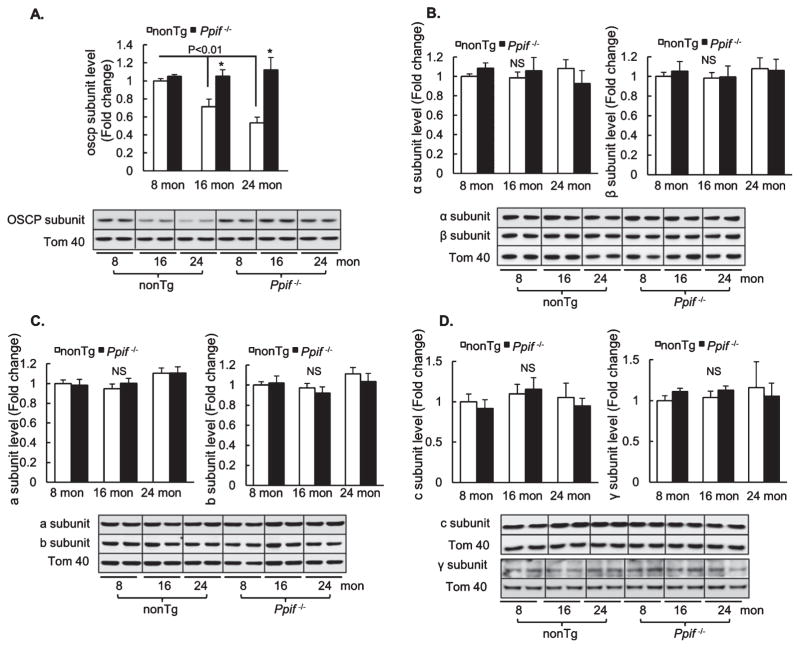
Fig. 3.
Selective loss of OSCP in brain mitochondria with age. Densitometric quantification of the expression levels of OSCP (A), α (B), β (B), a (C), b (C), c (D), and γ (D) subunits in brain mitochondria of 8-, 16-, and 24-month-old nonTg and Ppif−/− mice. N = 6–10 mice per group. The lower panels are representative immunoreactive bands of indicated proteins. Tom40 was used as the loading control. *p < 0.05 versus age-matched nonTg counterpart.

